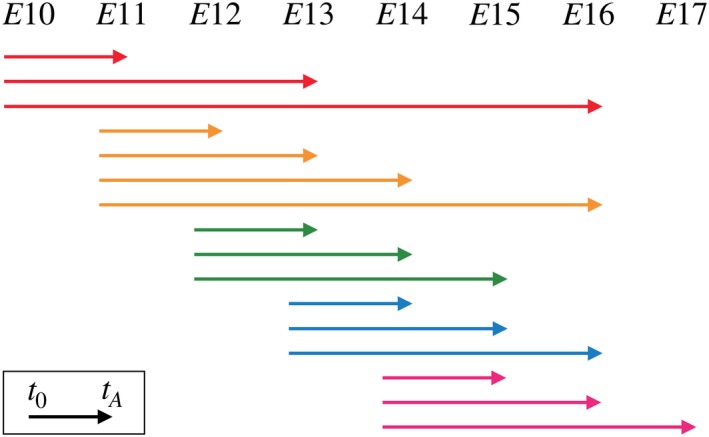
Figure 2.

Experimental setups of the Mosaic Analysis with Double Markers (MADM) dataset include intervals defined by injection and analysis time, t 0 and t A, respectively, over the mouse neurogenic window E10–E17. The MADM labelling is induced at t 0 and the sizes of subclones are quantified at t A. For a representation of the entire dataset, see Fig. S1.
