
Figure 4.
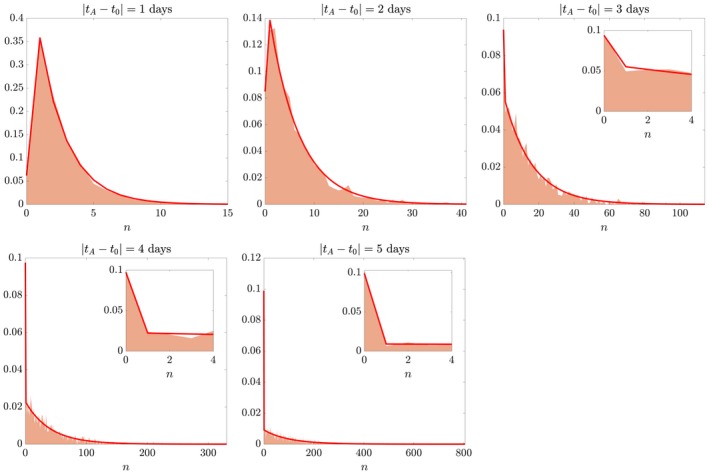
Virtual clonal analysis. Checking theory (solid line) against simulated data (coloured patches) with known parameters λ = 1 day−1 and μ = 0.1 day−1. For ease of visualisation, the distributions of simulated data are plotted as midpoints of bins centred around each clonal size n. Insets show a magnification on the smaller range of clonal sizes n, including the case n = 0 of extinct clones. Vertical axis is probability density.