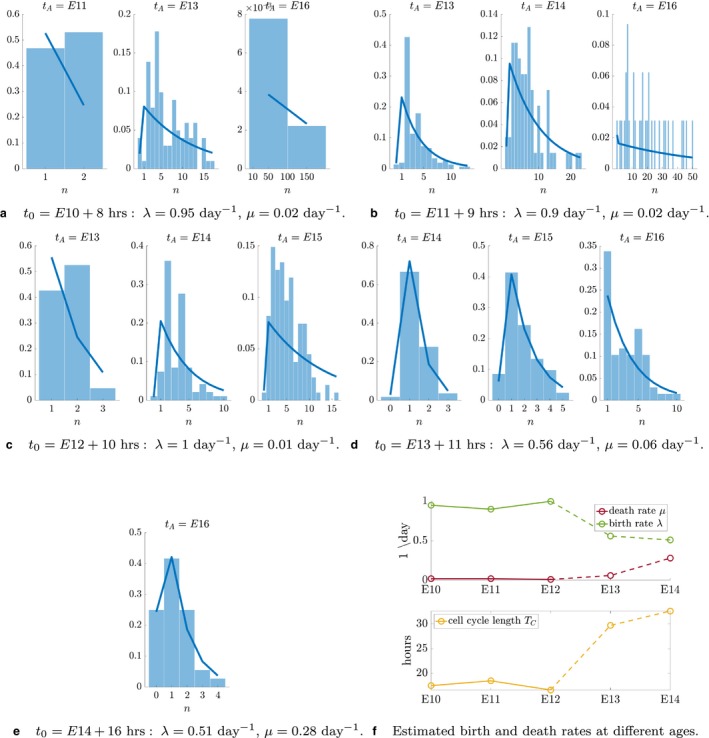
Figure 6.

Parameterisation of the stochastic birth–death process using the Mosaic Analysis with Double Markers (MADM) dataset. Values of λ and μ are guessed for each injection time. (a–e) The solid line is the theoretical distribution parameterised on these values. Histograms show the distribution of the experimental data. The error is quantified as the Euclidean distance between the two, i.e. , where y is the probability density function described by Eq. (1). (f) Temporal evolution of model parameters and predicted average cell cycle length [calculated as: T C = log(2)/λ]. The dashed portion of lines indicates predictions that do not match the existing literature and need validation via experimental quantification.
