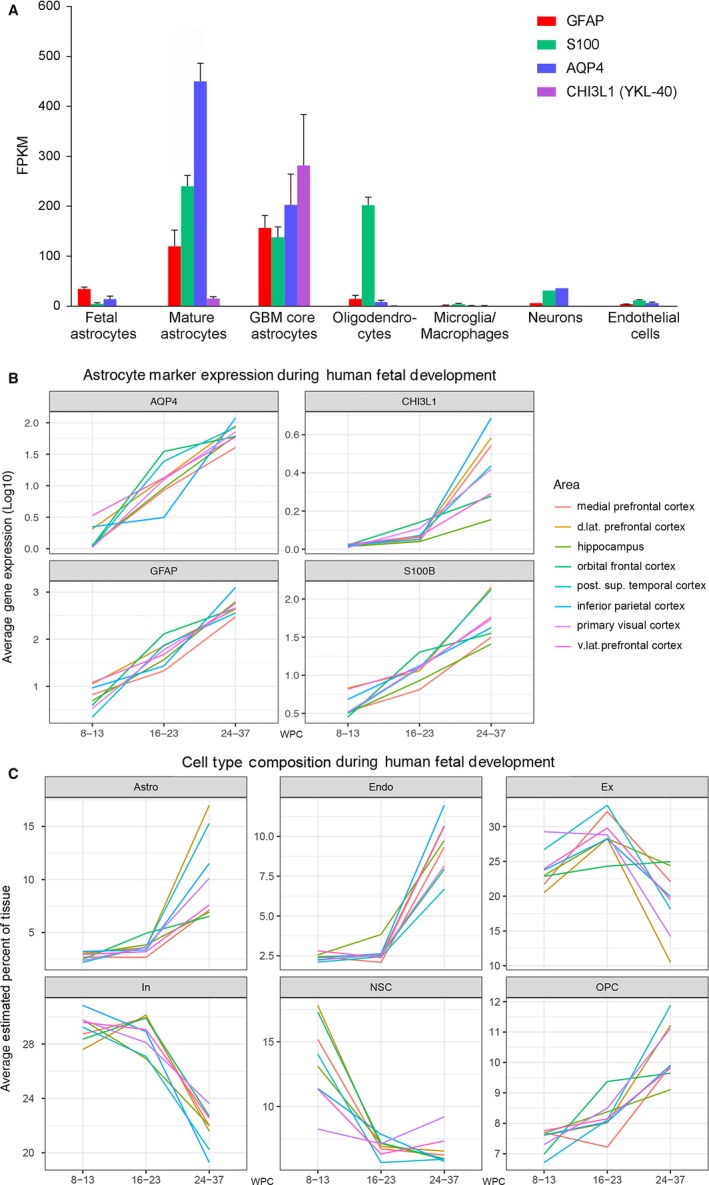
Figure 1.

RNA expression of GFAP, S100B,AQP4 and CHI3L1‐40 in human developing and adult brain and estimation of cell‐type proportions in developing human brain. (A) RNA expression of GFAP, S100B,AQP4 and CHI3L1 (YKL‐40) in specific cell types in samples from human healthy temporal cortex (8–63 years, n = 12 for astrocytes, n = 5 for oligodendrocytes, n = 3 for microglia/macrophages, n = 1 for neurons, n = 2 for endothelial cells), astrocytes from fetal brain (16–16.5 wpc, n = 6) and astrocytes from glioblastoma tumor core (59–65 years, n = 3). Expression is listed as mean ± SEM (standard error of the mean) in FPKM. The RNA‐seq data in (A) was generously shared by the Barres Lab and is based on specific cell‐type suspensions derived by immunopanning (www.brainrnaseq.org) (Zhang et al. 2016). (B) is based a different dataset, consisting of RNA‐seq quantification of different brain regions in developing human brain and shows average gene expression (log10) (y‐axis) of GFAP, S100B, AQP4 and CHI3L1 (YKL‐40) (subplots) across all samples within three age intervals (early, mid‐ and late prenatal) (x‐axis) for selected brain regions (colors). Within the same dataset (C) shows average cell‐type proportions (y‐axis) for major cell types (subplots) within the same age groups (x‐axis) and regions (colors) as listed in (B). Specification of cell types (Box 2) is based on single‐cell RNA‐seq performed by Fan et al. (2018). RNA‐seq data for (B) and (C) originates from www.brainspan.org. For clarity, only cell types identified as making up more than 10% of cells, in at least one of the regions analyzed, are shown. Astro, astrocytes; d. lat, dorsolateral; Endo, endothelial cells; Ex, excitatory neurons; In, inhibitory neurons; NSC, neural stem cells; OPC, oligodendrocyte progenitor cells; post. sup, posterior superior; v.lat, ventrolateral.
