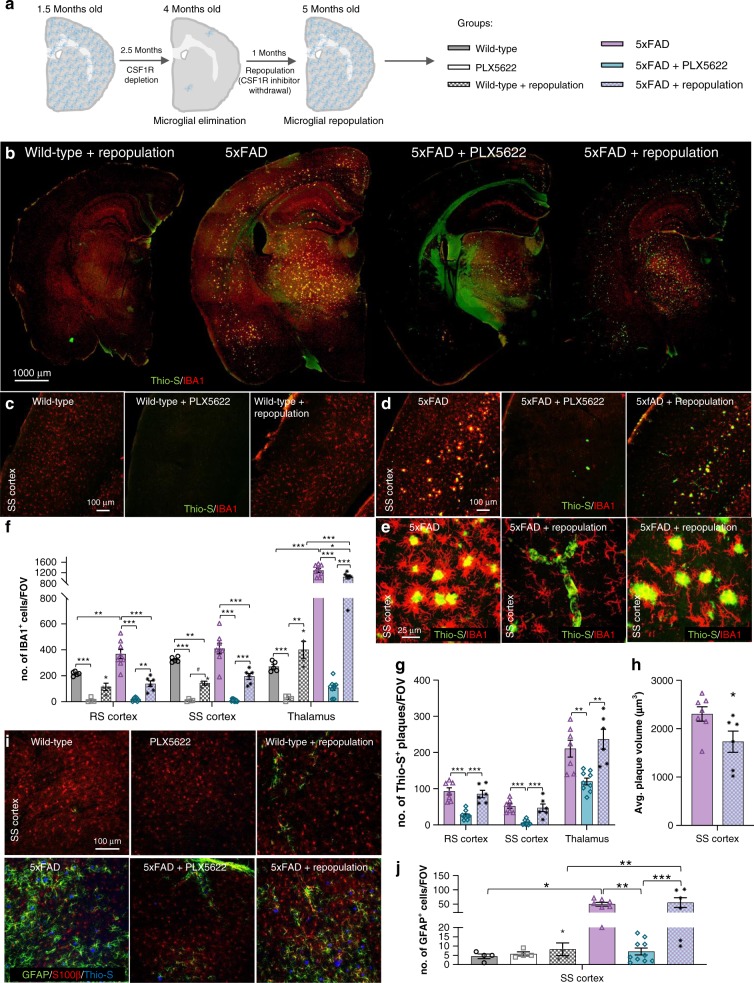
Fig. 10.
Microglia seed plaques. All analyses listed in respective order for retrosplenial (RS) cortex, somatosensory (SS) cortex, and thalamus. a Experimental design: 1.5-month-old wild-type (WT) and 5xFAD mice were administered PLX5622 (1200 ppm in chow) until 4 months of age. Diet was withdrawn for 1 month to allow microglial repopulation. This figure was created with images adapted from Servier Medical Arts and is licensed under the Creative Commons Attribution 3.0 Unported License [https://creativecommons.org/licenses/by/3.0/]. b Representative hemisphere stitches of sections stained for dense core plaques (Thio-S in green) and immunolabeled for microglia (IBA1 in red). Scale bar = 1000 μm. c–e Images of dense-core plaque staining (Thio-S in green) and microglia immunolabeling (IBA1 in red). Scale bar = 100 μm for C,D; 25 μm for E. f, IBA1+ cell number (WT v 5xFAD, p = 0.001, NS, p < 0.001; WT v PLX5622, p < 0.001, p < 0.001, p < 0.001; 5xFAD v 5xFAD + PLX5622, p < 0.001, p < 0.001, p < 0.001; PLX5622 v Repopulation, NS, p = 0.054, p = 0.008; 5xFAD + PLX5622 v 5xFAD + Repopulation, p = 0.006, p < 0.001, p < 0.001; WT v Repopulation, NS, p = 0.002, NS; 5xFAD v 5xFAD + Repopulation, p < 0.001, p < 0.001, p = 0.027; Repopulation v. 5xFAD + Repopulation, NS, NS, p < 0.001). Two-way ANOVA with Tukey’s post hoc test; n = 5 for Wild-type, n = 4 for PLX5622, n = 4 for Wild-type + Repopulation, n = 8 for 5xFAD, n = 9 for 5xFAD + PLX5622, n = 6 for 5xFAD + Repopulation. g Quantification of Thio-S+ plaque number (5xFAD v 5xFAD + PLX5622, p < 0.001, p < 0.001, p = 0.007; 5xFAD + PLX5622 v 5xFAD + Repopulation, p < 0.001, p < 0.001, p = 0.001; 5xFAD v 5xFAD + Repopulation, NS, NS, NS). One-way ANOVA with Tukey’s post hoc test; n = 7 for 5xFAD, n = 9 for 5xFAD + PLX5622, n = 6 for 5xFAD + Repopulation. h Mean cortical plaque volumes (5xFAD v 5xFAD + Repopulation, p = 0.048). Two-tailed independent t-test; n = 7 for 5xFAD, n = 6 for 5xFAD + Repopulation. I Images of dense-core plaques (Thio-S in blue) and astrocytes with GFAP (in green) and S100β (in red). Scale bar = 100 μm. j GFAP+ astrocyte number in the SS cortex (WT v 5xFAD, p = 0.010; 5xFAD v 5xFAD + PLX5622, p = 0.002; 5xFAD + PLX5622 v 5xFAD + Repopulation, p < 0.001; WT + Repopulation v 5xFAD + Repopulation, p < 0.009). Two-way ANOVA with Tukey’s post hoc test; n = 4 for Wild-type, n = 4 for PLX5622, n = 4 for Wild-type + Repopulation, n = 7 for 5xFAD, n = 10 for 5xFAD + PLX5622, n = 6 for 5xFAD + Repopulation. Statistical significance is denoted by *p < 0.05, **p < 0.01, and ***p < 0.001. NS, not significant (p > 0.10). Error bars indicate SEM

