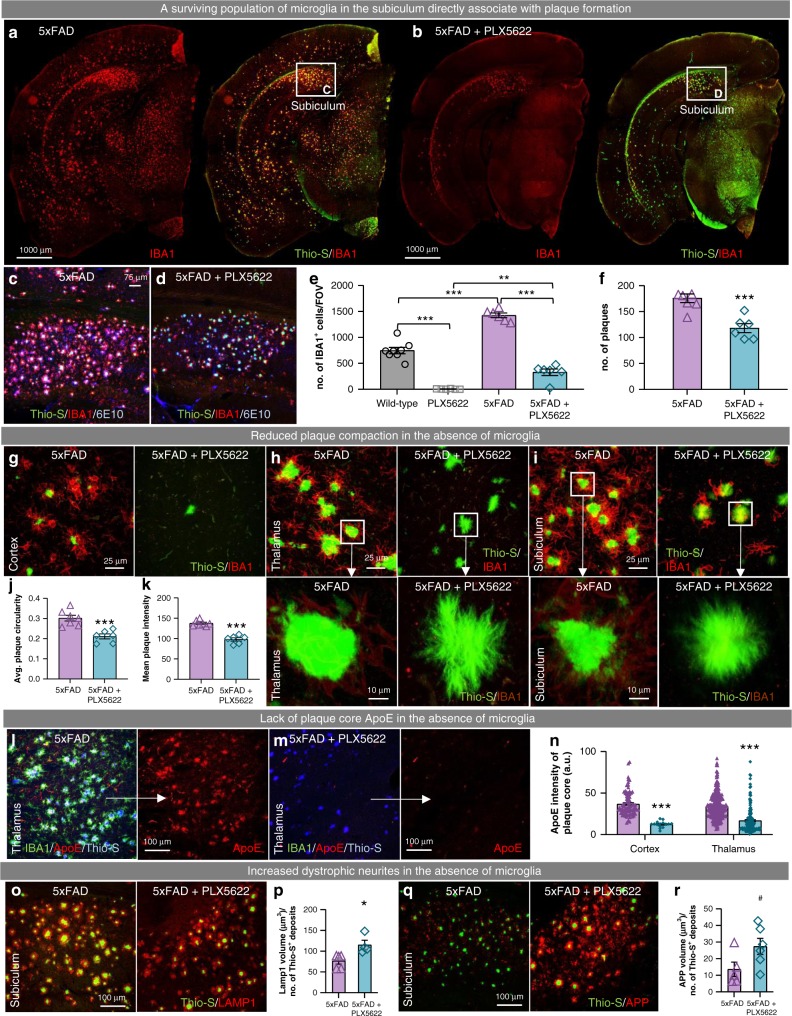
Fig. 6.
Microglia facilitate plaque formation and compaction. a, b, Representative hemisphere stitches of 5xFAD and 5xFAD + PLX5622 mice stained for dense-core plaques (Thio-S in green) and immunolabeled for microglia (IBA1 in red). Scale bar = 1000 μm. c, d Confocal images of subicula stained with Thio-S for dense core plaques (green) and immunolabeled with IBA1 for microglia (red) and 6E10 for diffuse plaques (blue). Scale bar = 75 μm. e Quantification of IBA1+ cells in the subiculum (WT v 5xFAD, p < 0.001; WT v PLX5622, p < 0.001; PLX5622 v. 5xfAD + PLX5622, p = 0.002; 5xFAD v 5xFAD + PLX5622, p < 0.001). Two-way ANOVA with Tukey’s post hoc test; n = 7 for Wild-type, n = 6 for PLX5622, n = 6 for 5xFAD, n = 6 for 5xFAD + PLX5622. f, Plaque number within the subiculum is reduced by 33% in 5xFAD + PLX5622 mice compared to 5xFAD animals (p < 0.001). Two-tailed independent t-test; n = 6 for 5xFAD, n = 6 for 5xFAD + PLX5622. g–i Confocal images of dense-core plaques (Thio-S in green) and microglia (IBA1 in red) in the cortex, thalamus, and subiculum, respectively, of both 5xFAD groups showing an alteration in plaque morphology with CSF1R inhibitor treatment. Scale bar = 25 μm. Arrows point to zoomed images of dense-core plaques. Scale bar = 10 μm. j, k, Quantification of plaque circularity (j; 5xFAD v 5xFAD + PLX5622, p < 0.001) and Thio-S fluorescence intensity (k; 5xFAD v 5xFAD + PLX5622, p < 0.001). Two-tailed independent t-test; n = 6–7 for 5xFAD, n = 6 for 5xFAD + PLX5622. l–m Representative images from 7-month-old cohort immunolabled for ApoE (in red) and microglia (IBA1 in green) and stained for dense-core deposits (Thio-S in blue). Scale bar = 100 μm. n Quantification of ApoE immunoreactivity in plaque cores (cortex: p < 0.001; thalamus: p < 0.001). Two-tailed independent t-test; n = 7–10 for 5xFAD, n = 7 for 5xFAD + PLX5622. o–r, Immunolabeling and quantification of LAMP1 (o, p; p = 0.020) and APP (q, r; p = 0.068). Two-tailed independent t-test; n = 5 for 5xFAD, n = 4–5 for 5xFAD + PLX5622. Scale bar = 100 μm. Statistical significance is denoted by *p < 0.05, **p < 0.01, and ***p < 0.001. Statistical trends are denoted by #p < 0.10. Error bars indicate SEM

