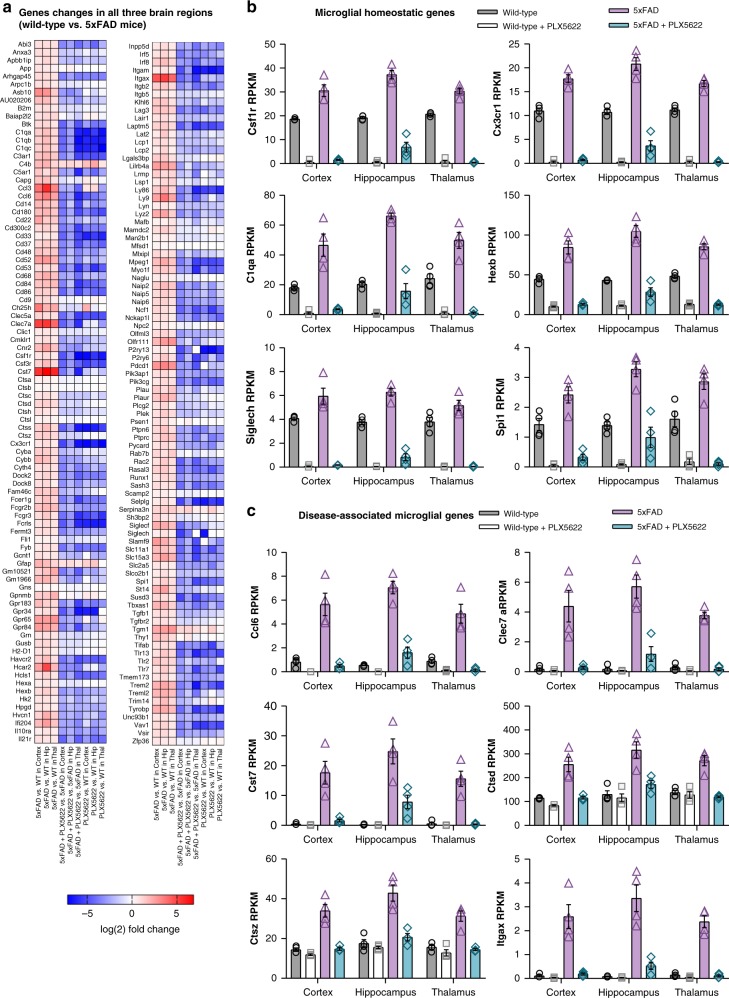
Fig. 8.
Remaining plaque-forming microglia in the microdissected hippocampus exhibit a DAM expression profile. a All gene expression changes where p < 0.05 for Wild-type (WT) vs. 5xFAD in all three brain regions shown as Log(2) fold change for each gene, for the 9 relevant comparisons (5xFAD vs. WT in cortex, hippocampus, or thalamus, 5xFAD + PLX5622 vs. 5xFAD in cortex, hippocampus, or thalamus, and WT + PLX5622 vs. WT in cortex, hippocampus, or thalamus). b RPKM values shown for a subset of the homeostatic microglial genes from (a), including Csf1r, Cx3cr1, C1qa, Hexb, Siglech, and Spi1. c RPKM values shown for a subset of the disease-associated microglial genes from (a), including Ccl6, Clec7a, Cst7, Ctsd, Ctsz, and Itgax. RPKM values for all genes/brain regions can be found at [https://rnaseq.mind.uci.edu/green/ad_plx/gene_search.php]. n = 4 per group for all analyses. Error bars indicate SEM

