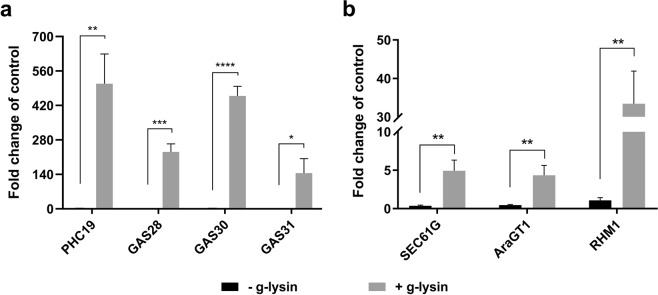
Figure 1.
Transcription of CW genes in response to gametolysin treatment shows global upregulation. (a,b) Bar graphs represent the change in expression for cell wall protein-encoding (a) and protein processing-related (b) genes in wild type (CC-125) cells. Untreated control samples are represented by black bars, grey bars represent cells treated with g-lysin. Gene expression is quantified in terms of fold change compared to the samples before the g-lysin treatment. Error bars represent one standard deviation from the mean of biological triplicate samples. Welch’s t-test indicates statistical significance at p ≤ 0.05 (*), p ≤ 0.01 (**), p ≤ 0.001 (***), p ≤ 0.0001 (****); α = 0.05.

