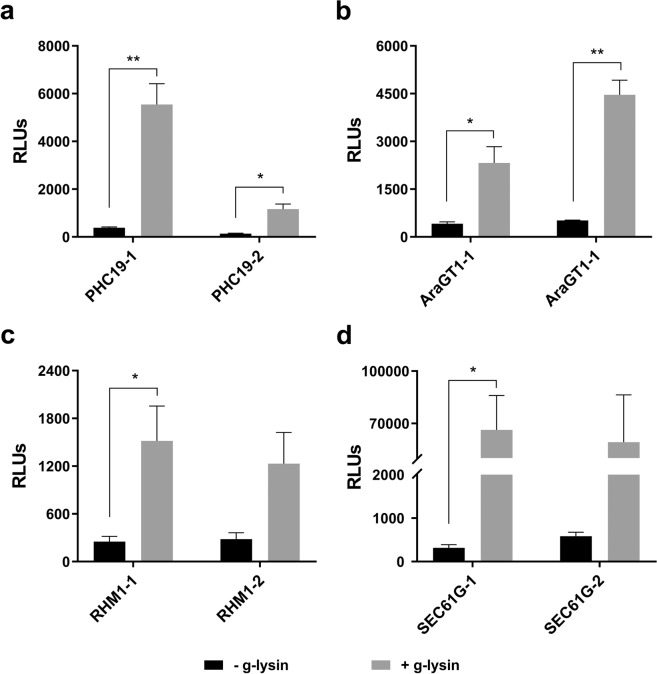
Figure 2.
Promoter-driven luciferase activity increases in response to g-lysin treatment. Bar graphs represent the change in promoter activity of PHC19 (a), AraGT1 (b), RHM1 (c), and SEC61G (d) genes, using two independent promoter-transformed lines. Luciferase activity is expressed as relative light units (RLUs) based on luminescence quantification. Untreated gamete control samples are represented by black bars. Grey bars represent gamete cells treated with g-lysin. Error bars are one standard deviation from the mean of biological triplicate data. Welch’s t-test indicates statistical significance at p ≤ 0.05 (*), p ≤ 0.01 (**); α = 0.05. RHM1-2 and SEC61G-2 showed a large variation that resulted in significance at 0.055 and 0.064, respectively, below the 95% cutoff.

