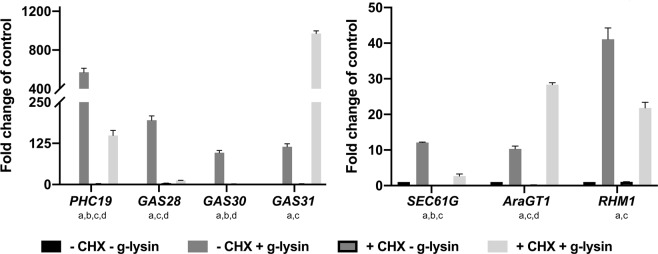
Figure 3.
Transcripts are differentially affected by CHX pretreatment prior to gametolysin treatment. (a,b) Bar graphs represent the change in gene expression for cell wall protein (a) and protein processing type (b) CW gene transcripts in wild type (CC-125) cells. Untreated gamete control samples represented by black bars, −CHX −g-lysin; medium grey bars for CHX treated cells, +CHX; dark grey bars for cells treated with g-lysin, +g-lysin; light grey bars for both CHX and g-lysin-treated cells, +CHX +g-lysin. Gene expression is quantified in terms of fold change of the untreated control condition. Error bars represent one standard deviation from the mean of biological triplicate samples. Letters below gene names indicate a significant difference between the specified samples using a two-way ANOVA at p ≤ 0.01; α = 0.05; ‘a’ for −CHX −g-lysin vs. +g-lysin, ‘b’ for −CHX -g-lysin vs. +CHX, ‘c’ for −CHX -g-lysin vs. +CHX +g-lysin, and ‘d’ for +g-lysin vs. +CHX +g-lysin.

