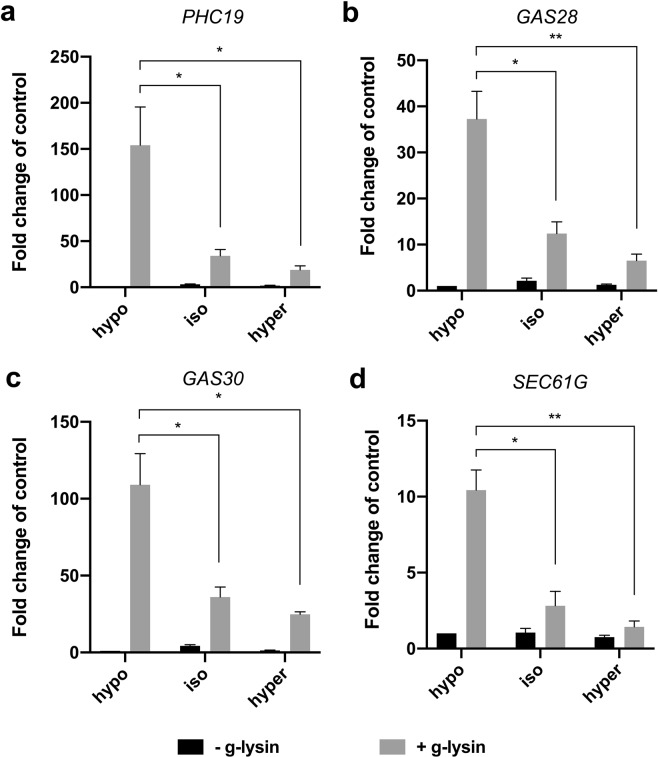
Figure 4.
Isotonic and hypertonic conditions negatively affect the g-lysin-induced CW gene activation. (a–d) Bar graphs represent the change in gene expression by g-lysin treatment for PHC19 (a), GAS28 (b), GAS30 (c), and SEC61G (d) in wild type (CC-125) cells. g-lysin treatment was done in three constant osmotic conditions, hypo- (64 mOsm), iso- (175 mOsm), and hyper- (204 mOsm). Untreated gamete control samples represented by black bars, −g-lysin; medium grey bars for g-lysin-treated cells, +g-lysin. Gene expression is quantified in terms of fold change of the untreated control in hypotonic condition. Error bars represent one standard deviation from the mean of biological triplicate samples. Welch’s t-test indicates statistical significance at p ≤ 0.01 (*), p ≤ 0.001 (**); α = 0.05.

