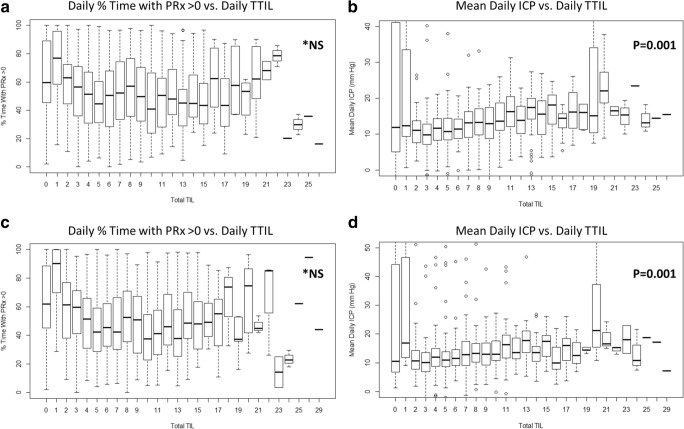
Fig. 2.
Boxplots of mean daily ICP and mean daily % time with PRx > 0 versus daily total TIL. ICP, intra-cranial pressure; MAP, mean arterial pressure; mmHg, millimeter of mercury; NS, non-significant; TIL, therapeutic intensity level; TTIL, total daily TIL. *p values reported are for the Jonckheere-Terpstra test for increasing mean values. Relationship between % time and PRx > 0 was non-significant for both increasing and decreasing mean values. Plot of mean daily % time with PRx above 0 versus daily TTIL a; Plot of mean daily ICP versus daily TTIL b; Plot of mean daily % time with PRx above 0 versus daily TTIL for time-shifted data c; Plot of mean daily ICP versus daily TTIL for time-shifted data d

