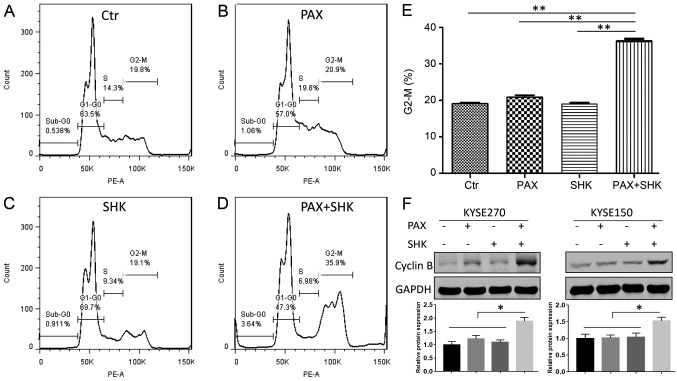
Figure 2.
Effects of shikonin and paclitaxel on cell cycle phase distribution. KYSE270 and KYSE150 cells were exposed to 100 nM paclitaxel for 24 h in either the presence or absence of shikonin (1 µM). Cell cycle phase distribution was determined by flow cytometry analysis of (A) control cells, (B) paclitaxel-treated cells, (C) shikonin-treated cells and (D) cells treated with paclitaxel and shikonin. (E) The mitotic cell percentage was calculated based on the percentage of G2-M phase cells in cell cycle analysis. (F) Top panel, the cellular protein expression of cyclin B was analyzed by western blotting. Bottom panel, the blots were quantitated desitometrically and for quantitation of cyclikn B level, data had been normalized by the level of GAPDH. Data were analyzed by one-way ANOVA with Dunnett's multiple comparisons test, and presented as the mean ± standard error or the mean from three independent experiments. *P<0.05 and **P<0.001. Ctr, control; PAX, paclitaxel; SHK, shikonin.

