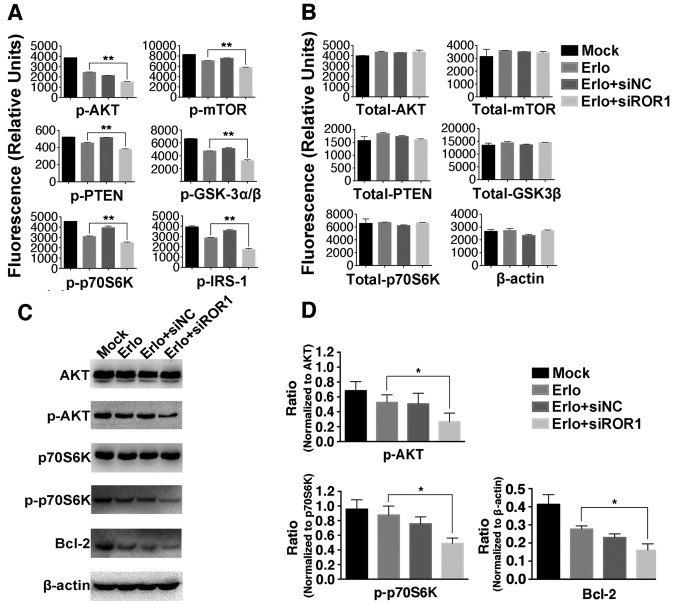
Figure 4.
Inhibition of ROR1 has an additive role with erlotinib in the NCI-H1975 cell line via the AKT/mTOR signaling pathway. NCI-H1975 cells were treated with Mock, 2.5 µM erlotinib alone, 2.5 µM erlotinib + 25 nM siNC or 2.5 µM erlotinib + 25 nM siROR1. The (A) phosphorylated and (B) total protein levels were analyzed using the Bio-Plex signaling AKT 8-plex panel and Bio-Plex pro signaling reagent kit, because the kit did not contain antibody detecting total protein of IRS-1, β-actin was used as control instead. Values are presented as relative fluorescence units. Data are presented as the mean of three independent experiments. (C) The phosphorylated and total protein expression levels of AKT, p70S6K, Bcl-2 and β-actin were determined using western blot analysis. (D) The integrated density analysis demonstrated the changes in the expression levels of p-AKT, p-p70S6K and Bcl-2, and difference in phosphorylated protein levels was analyzed using ratios between the phosphorylated/total protein. Experiments were performed 3 times (n=3). Statistical analysis was performed using analysis of variance. *P<0.05 and **P<0.01, erlotinib treated group vs. erlotinib+siROR1 treated group. ROR1, receptor tyrosine kinase-like orphan receptor 1; si, small interfering; NC, negative control; Mock, complete medium; mTOR, mammalian target of rapamycin; IRS-1, insulin receptor substrate 1; GSK-3α/β, glycogen synthase kinase-3α/β; p, phosphorylated.

