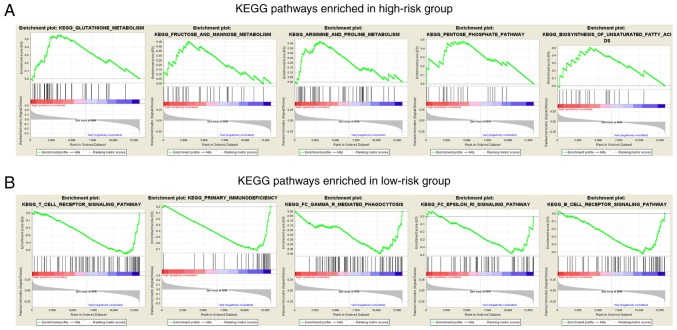
Figure 8.
GSEA analysis. (A) Top five GSEA enrichment analysis results of the KEGG pathways for the high-risk group. Pathways associated with nutrient metabolism of cancer cells were significantly enriched in the high-risk group. (B) Top five GSEA enrichment analysis results of the KEGG pathways in the low-risk group. Pathways associated with immune regulation against cancer were significantly enriched in the low-risk group. GSEA, Gene Set Enrichment Analysis; KEGG, Kyoto Encyclopedia of Genes and Genomes.

