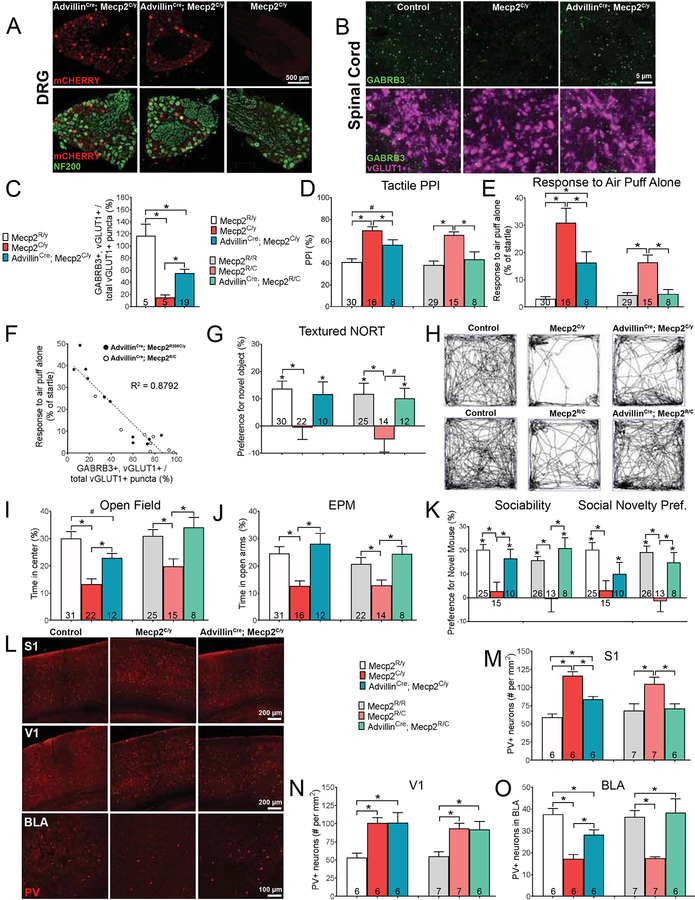
Figure 4. Viral expression of GABRB3 in peripheral sensory neurons, beginning at P5, improves some tactile, brain and behavioral deficits observed in Mecp2R306C mutant mice.
(A) Intraperitoneal (i.p.) injection of AAV.FLEx.GABRB3.mCHERRY into AdvillinCre; Mecp2C/y hemizygous null mutant mice at P5 transduces peripheral sensory neurons, as evidenced by immunoreactivity for mCHERRY. Transduced large diameter neurons are immunoreactive for both mCHERRY and NF200. All littermates received i.p. injection of AAV.FLEx.GABRB3.mCHERRY at P5.
(B) IHC images of spinal cord (SC) dorsal horn lamina III/IV from male control, Mecp2C/y or AdvillinCre; Mecp2C/y mice, showing GABRB3 puncta at vGLUT1+ presynaptic terminals for Aα and Aδ LTMRs.
(C) Quantification of vGLUT1+ puncta co-labeled with GABRB3, relative to the total number of vGLUT1+ puncta visualized per image of SC dorsal horn. One-way ANOVA with post-hoc Tukey’s test, *, p < 0.01.
(D) Percent inhibition of the startle response to a 125 dB noise, when the startle noise is preceded by a light air puff in male control, Mecp2C/y, AdvillinCre; Mecp2C/y or female control, Mecp2R/C, and AdvillinCre; Mecp2R/C mice. One-way ANOVA with post-hoc Tukey’s test, *, p < 0.05; #, p < 0.10.
(E) Response to a light air puff stimulus alone. Responses are expressed as percent of startle response to a 125 dB noise. One-way ANOVA with post-hoc Tukey’s test, *, p < 0.05.
(F) The percentage of vGLUT1+ puncta co-labeled with GABRB3, relative to the total number of vGLUT1+ puncta is negatively correlated with hairy skin sensitivity. Comparison of individual animals’ expression levels of GABRB3 at vGLUT1+ terminals, to their responses to a light air puff stimulus (50 ms, 0.9 PSI). Linear regression analysis, R2 = 0.8792.
(G) Discrimination index for textured NORT. Student’s unpaired t-test or one-way ANOVA with post-hoc Tukey’s test, *, p < 0.05; #, p < 0.10.
(H) Representative activity traces in the OF test.
(I) Percent time spent in the center of the OF chamber. One-way ANOVA with post-hoc Tukey’s test, *, p < 0.05; #, p < 0.10.
(J) Percent time spent in the open arms of the EPM. One-way ANOVA with post-hoc Tukey’s test, *, p < 0.05.
(K) Preference index for the percentage of time spent investigating the novel mouse in the “Sociability” or “Social Novelty Preference” portion of the 3-chamber social interaction test. One-way ANOVA with post-hoc Tukey’s test, *, p < 0.05.
(L) Representative IHC images of coronal S1, V1 and BLA brain sections, showing PV immunoreactivity in control, Mecp2C/y or AdvillinCre; Mecp2C/y mice.
(M-O) Quantification of the number of PV-positive (PV+) neurons in S1 (M), V1 (N), and BLA (O) in mutant, mutant rescues and their control littermates. One-way ANOVA with post-hoc Tukey’s test, *, p < 0.05.

