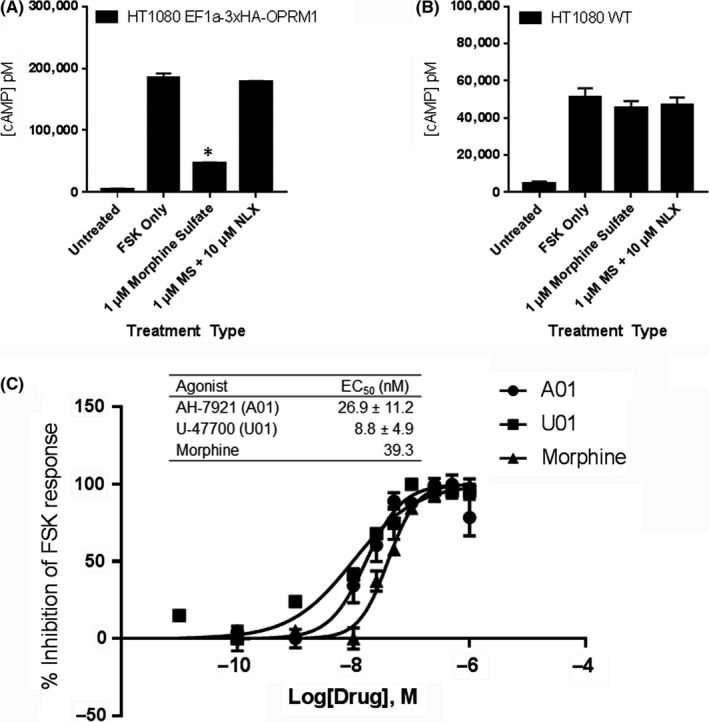
Figure 4.

Pharmacological validation of HT1080 hMOR cells. (A) HT1080 hMOR cells are treated with 100 μmol L−1 of forskolin (FSK) only, FSK with 1 μmol L−1 morphine sulfate (MS), FSK with MS plus 10 μmol L−1 NLX, or PBS only (Untreated). (B) HT1080 WT is treated similarly. Data from representative experiment are shown. Statistical analysis is performed using one‐way ANOVA with Dunnett multiple comparison test with FSK only as standard. *P < 0.05. (C) Dose response curve and EC50 values table for morphine, AH‐7921 (A01), and U‐47700 (U01) in the HT1080 hMOR cell line. Each data point was performed in triplicate and repeated three times (n = 3). Data from representative experiment are shown
