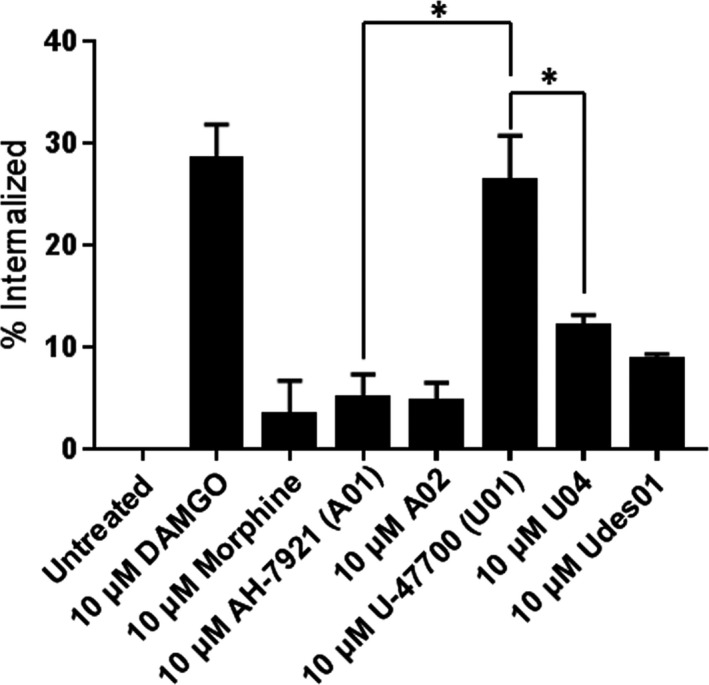
Figure 8.

Measuring hMOR internalization levels after treatment with the high potency compounds. HT1080 hMOR cells were treated with the indicated concentration of drugs for 1 hour, then analyzed using flow cytometry to evaluate the changes in surface hMOR compared to untreated cells. The average internalization percentage is shown (n = 3). Data were analyzed using unpaired t test. *P < 0.05
