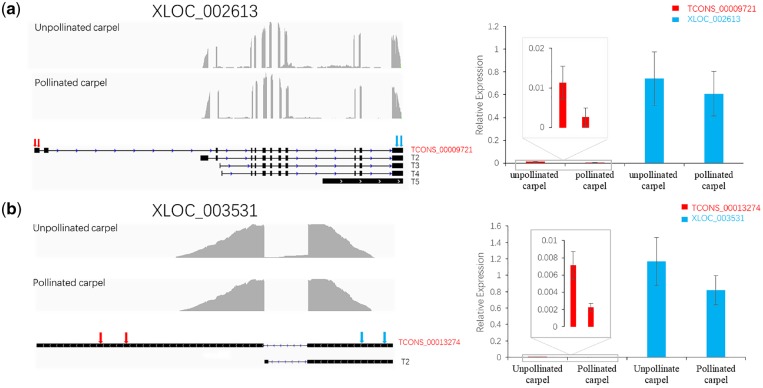
Figure 6.
qRT-PCR validation of differential expressed isoforms corresponding gene not differential expressed. (a) Isoform structure of gene XLOC_002613 was shown in left panel; the qRT-PCR results of isoform TCONS_00009721 and gene XLOC_002613 were in right panel. (b) Isoform structure of gene XLOC_003531 was shown in left panel; the qRT-PCR result of isoform TCONS_00013274 and gene XLOC_003531 were in the right panel. Grey peaks indicated read coverage. Black box and line show exons and introns. The region of the two arrows at left side is the specific region of validated isoforms. The region of the two arrows at right side is the comment region of all isoforms, the expression of this region was regarded as expression of this gene. The inserted panels are the enlarged view of the rectangle regions.

