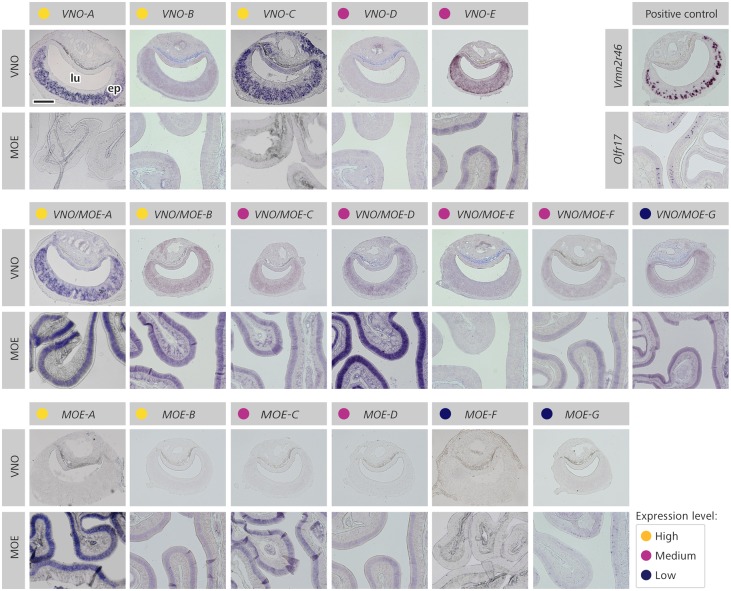
Figure 3.
Spatial patterns of expression for selected lncRNAs in the olfactory epithelia of MOE and VNO. Representative microscopy images of olfactory tissue sections subjected to chromogenic in situ hybridization staining (purple) with riboprobes for selected preferentially expressed lncRNAs. lncRNA names are as listed on Table 2. The top, middle, and bottom lines of images represent transcripts in the VNOpref, VNO+MOEpref, and MOEpref groups, respectively. At the end of the first line, controls of hybridization are shown for comparison, including expression of an olfactory receptor gene (Olfr17) for the MOE, and staining for vomeronasal organ Vmn2r46 probe for the VNO. Expression level groups ‘high’, ‘medium’, and ‘low’ were determined according to expression quartiles (Supplementary Fig. S4) and are indicated by yellow, magenta, and blue circles, respectively. lu, VNO lumen; ep, MOE or VNO sensory epithelia. Scale bar = 100 μm.

