Figure 5.
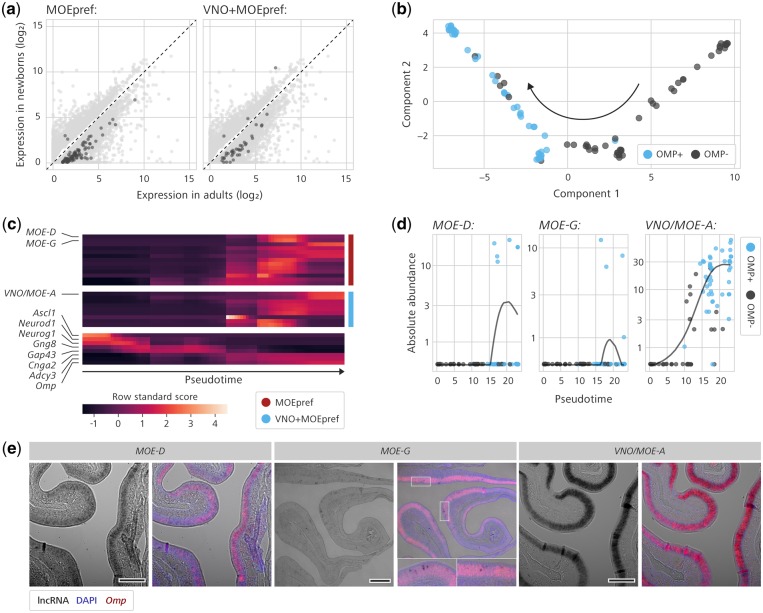
Discovery of lncRNAs differentially expressed in mature olfactory sensory neurons. (a) Mean expression levels (TPM) of all transcripts differentially expressed between adult (x-axis) and newborn (y-axis) in the mouse MOE. Each dot represents a differentially expressed transcript. Dots highlighted in dark grey colour are MOEpref (left) and VNO+MOEpref (right) lncRNA transcripts differentially expressed between adults and newborns. (b) Reconstructed trajectory of cell differentiation in the MOE, represented in a two-dimensional space (constructed using the DDRTree algorithm), based on gene expression analysis of 93 single-cell RNA-Seq transcriptomes.71 The black arrow indicates the presumptive progressive temporal sequence of events that transpires from the different single cells along a differentiation pseudotime. Single cells are colour-coded according to presence or absence of OMP expression (cut-off was absolute abundance ≥ 100). (c) Horizontal lines are abundance profiles across the 93 single cells ordered according to the pseudotime determined in (b), for 22 lncRNAs more highly expressed in adults and differentially expressed in OMP-positive single cells (see Supplementary Spreadsheet for complete list). These lncRNAs were taken as putative non-coding species expressed in mature olfactory sensory neurons. Expression of marker genes for several stages along the olfactory differentiation is shown at the bottom. Abundance values were normalized by standardized score calculation. The preferential expression classes (MOEpref or VNO+MOEpref) are shown on the right. Three lncRNA candidates are highlighted (MOE-D, MOE-G, and VNO/MOE-A), because they are multi-exon and were chosen for subsequent investigation. (d) Expression abundance data (y-axis) for lncRNAs MOE-D, MOE-G, and VNO/MOE-A along the olfactory differentiation path. The x-axis represents the pseudotime as measured in the bidimensional space. Black and blue dots represent OMP-negative and OMP-positive single cells, respectively. Black lines are smooth spline curves representing transcript expression dynamics along pseudotime, as determined by Monocle 2 software. (e) For each gene (MOE-D, MOE-G, and VNO/MOE-A), the left panel is a lower magnification microscopy black-and-white image of in situ hybridization on MOE sections, showing expression of the lncRNA (dark staining) throughout the sensory epithelium (ep) for MOE-D and VNO/MOE-A, and a striking punctate spatial pattern for MOE-G. The right panels are co-labelling for lncRNA (purple) and OMP (fluorescent staining in red). DAPI-stained nuclei are shown as blue overlaid fluorescence. For MOE-G, higher magnification images of insets in top, right panel are displayed at the bottom, showing details of co-localization of OMP and lncRNA. Size bar is 100 μm.

