Figure 1.
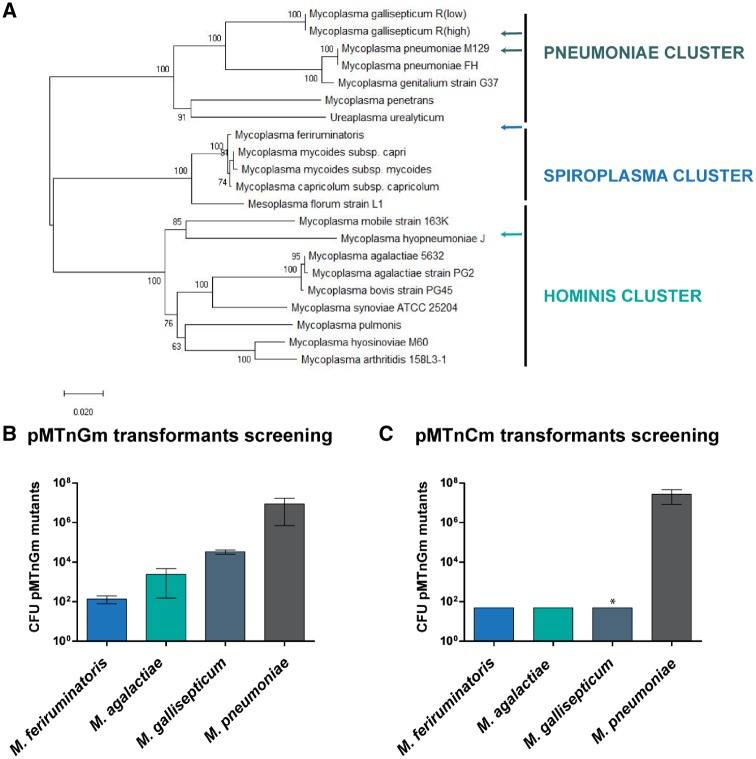
Screening of transposon TEs across the mycoplasmal landscape. (A) Phylogenetic tree of 21 selected Mycoplasma species in which three main clusters (pneumoniae, spiroplasma and hominis) can be identified using the maximum composite likelihood method. The tree is drawn to scale with branch lengths in the same units as those of the evolutionary distances used to infer the phylogenetic tree.29 (B) Bar plot showing the average of gentamicin resistant CFUs (in logarithmic scale) obtained for each of the indicated strains when using the pMTnGm vector (n = 3). (C) Bar plot showing the average of chloramphenicol resistant CFUs (in logarithmic scale) obtained for each of the indicated strains when using the pMTnCm vector. For the statistical analysis, for those species in which no mutants were detected the number of CFU was set to 49, the maximum value below the limit of detection. One-tailed t-test P-values are indicated with one asterisk (*) when P < 0.05 for TE obtained with pMTnGm vector compared to the TE obtained with pMTnCm vector.

