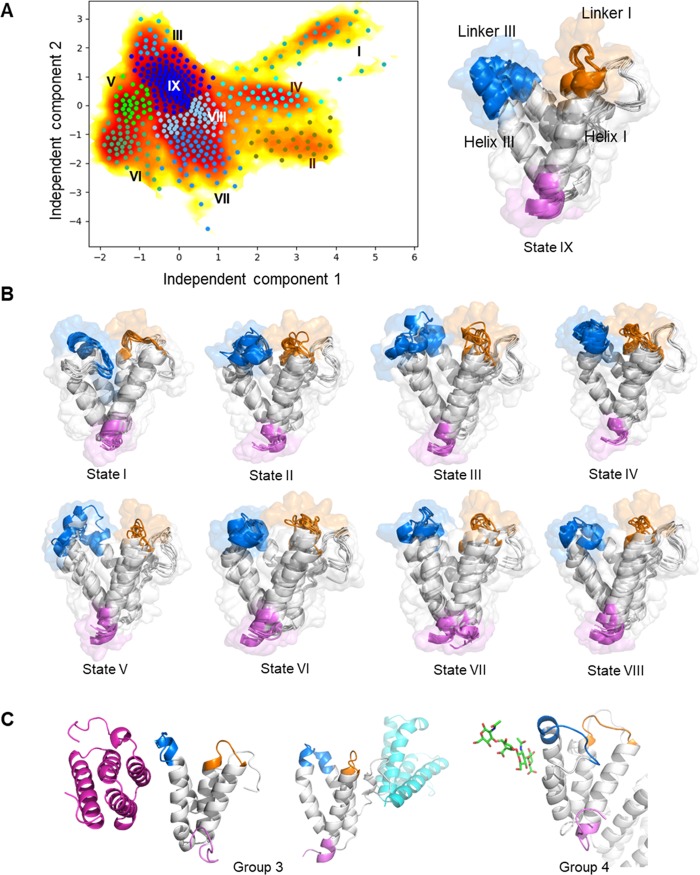
Figure 6.
Markov state modeling (MSM) for SAA1.1, the SAA1.1–hyaluronic acid complex, and the SAA2.2–hyaluronic acid complex identifies nine metastable states characterized by contact between linker I, linker III, helix I, and helix III. (A) Time-lagged independent component analysis (TICA) plot with microstates is shown in the left-hand panel. Microstates from k-means clustering are plotted with dots. The microstates are clustered into nine metastable states (I, light sea-green; II, olive; III, deep sky-blue; IV, aqua; V, lime; VI, medium sea-green; VII, dodger-blue; VIII, light sky-blue, and IX, blue). An illustration of linker I, linker III, helix I, and helix III is shown in the right-hand panel. (B) Representative structures of each metastable state. N-terminus, pink; linker I, marine; linker III, orange. (C) Interface and hyaluronic acid (green sticks) binding site for groups 3 and 4 of SAA1.1.

