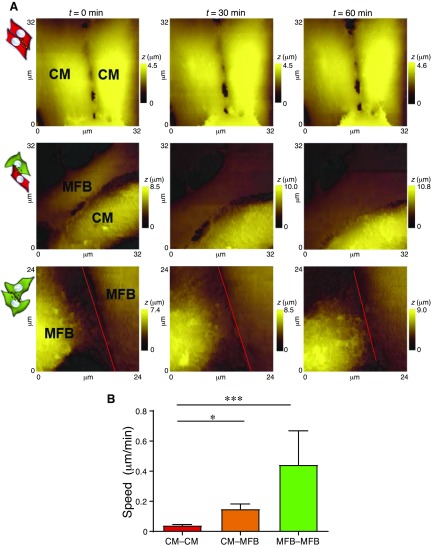
Figure 2.
Dynamism in control CM–CM, CM–MFB, and MFB–MFB contacts. A) Representative set of scans for each configuration. Cartoons indicate the configuration, as shown in Fig. 1. The red line is included for the contact between MFB–MFB for clarity. t, time; z, cell height. B) Movement speed of the contacts. All data are represented as means ± sem. *P ≤ 0.05, ***P ≤ 0.001.

