Figure 1.
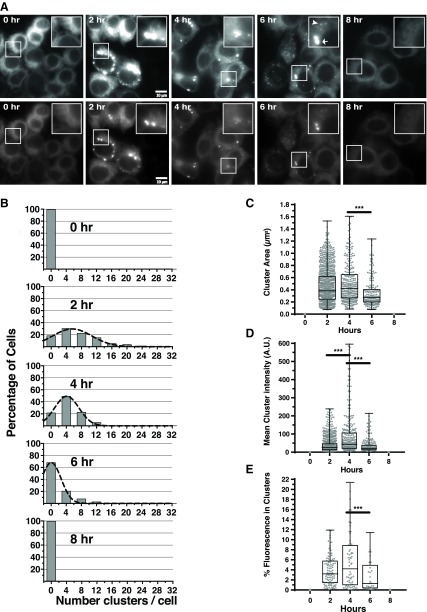
IRE1GFP clusters in HAP1KO cells in a transient fashion in response to ER stress. A) IRE1GFP clusters reversibly in response to the ER stressor Tm. Representative fields of HAP1KO cells expressing WT IRE1GFP that were exposed to Tm treatment for the indicated times. Each field is shown at 2 exposures, with the top series emphasizing the overall distribution of fluorescence and the bottom series keeping the exposure of clusters at the linear range of the camera. Insets: selected areas with IRE1GFP clusters. The cells had been incubated with 1 μg/ml dox for 24 h to induce WT IRE1GFP expression; dox was then removed, Tm (4 μg/ml) added to the medium, and the cells imaged. Zero hour: Reticular distribution of IRE1GFP. Two, four, and six hours: Clustered distribution of WT IRE1GFP. Arrow and arrowhead in the 6 h inset denote examples of large and small clusters. Eight hours: representative image of cells after 8 h of continuous exposure to Tm, when the clusters dispersed and returned to a reticular distribution. Scale bars, 10 μm. B) The time course of clustering. Time course of clustering displayed as histogram analyses of cell images taken at 0, 2, 4, 6, and 8 h Tm continuous treatment. At each time point, the numbers of clusters/cell was scored using the ImageJ algorithm (see Materials and Methods), binned, and the percentage of cells with each bin of clusters was plotted. Between 86 and 124 cells were analyzed per time point, taken from 3 independent time courses. All quantitations were performed on images within the linear range of the camera. C) Distribution of cluster sizes during the Tm time course. Each dot represents an individual cluster, and at each time point from 183 to 1056 clusters were counted. ***P < 0.01; n = 3. D) Distribution of cluster fluorescence intensities at each time point. Each dot is the integrated fluorescence intensity of a single cluster. E) Percentage of total cell fluorescence intensity found in clusters at each time point. Each dot represents a cell.

