
Fig. 3.
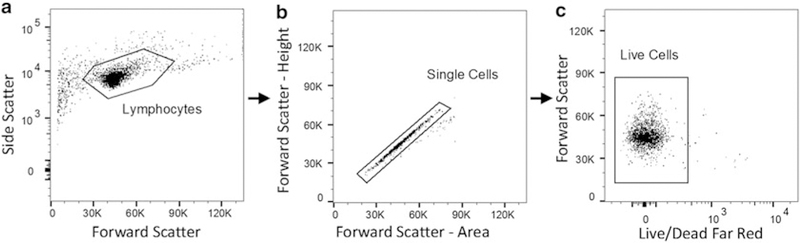
Example gating strategy using FlowJo software. (a) Start with forward scatter by side scatter and draw a gate around the cell type of interest, such as lymphocytes shown here. (b) Next analyze “forward scatter – area” by “forward scatter – height” to exclude any cell doublets. Make a gate around events that fall along the line y = x; these are single cells. If a live/dead stain has been used, draw a final gate around live cells. (c) In this example, dead cells fluoresce in the far red (APC-Cy7) channel, and therefore a gate has been drawn around the live (APC-Cy7Neg) cells