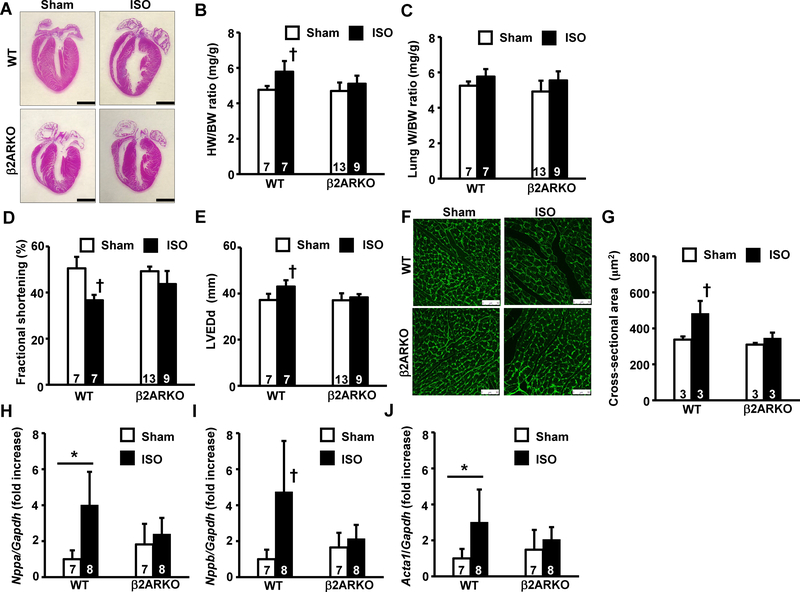
Fig 1. Deletion of β2AR attenuates cardiac hypertrophy after chronic β2AR stimulation in mice.
(A) Representative images of hematoxylin-eosin staining of whole hearts from wildtype control or β2ARKO mice 2 weeks after isoproterenol (ISO) stimulation or sham operation. The bar indicates 1 mm. (B) Gravimetric analysis. Heart weight (HW) normalized to body weight (BW) ratios are shown. (C) Lung weight normalized to BW (LW/BW) ratios. (D) Fractional shortening (%) obtained 2 weeks after sham operation or ISO-pump implantation by echocardiographic analysis. (E) Left ventricular dimension at end-diastole (LVEDd) obtained 2 weeks after sham operation or ISO-pump implantation by echocardiographic analysis. (F) Representative image of WGA-FITC conjugate staining of heart tissue. The bar indicates 50 μm. (G) Cross-sectional area measurements in WGA-FITC conjugate-stained hearts. (H, I, J) Expression levels of cardiac hypertrophic marker genes, Nppa (H), Nppb (I), and Acta1 (J), in ventricles from mouse cohorts determined by real-time RT-PCR. Values were normalized to that of GAPDH and are represented as fold increases relative to that in the wildtype sham group. Values are shown as mean ± SD, and the number displayed on each column indicates the number of samples. † P<0.05 vs. all other groups, *P<0.05 between two indicated groups by one-way ANOVA followed by Tukey–Kramer test.

