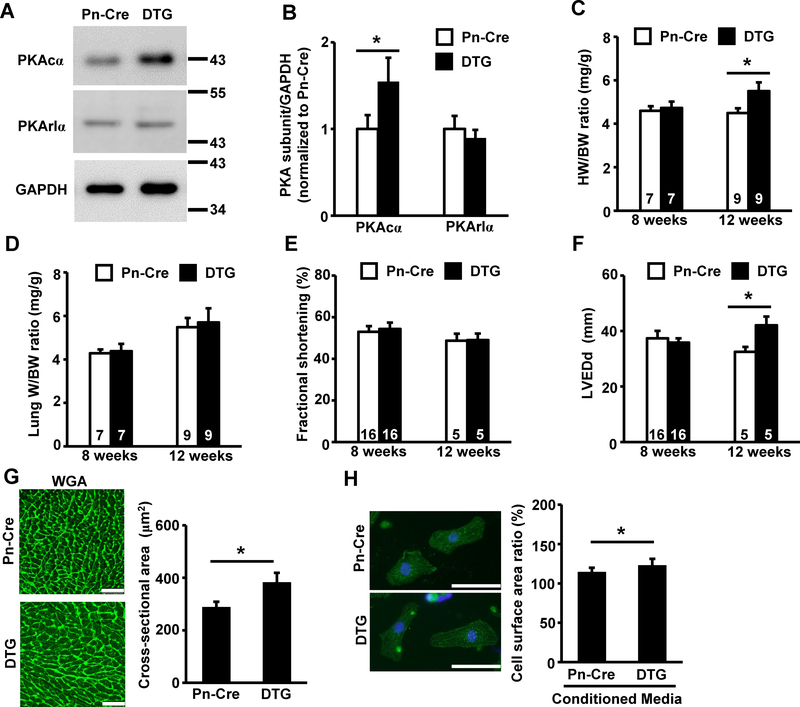
Fig 4. Fibroblast-specific activation of PKA mediates cardiac hypertrophy in mice.
(A) Representative image of immunoblot probed with indicated primary antibodies. Protein samples were prepared from adult cardiac fibroblasts from indicated genotypes at passage 2. The number on the right side of each panel indicates the size of the molecular marker. (B) Quantification of immunoblot bands using protein samples obtained from cardiac fibroblasts of Pn-Cre or DTG mice based on three independent experiments. (C, D) Gravimetric analysis of Pn-Cre and DTG mice. HW/BW ratio (C) or LW/BW ratio (D) at 8 weeks or 12 weeks of age are shown. (E) Fractional shortening (%) in Pn-Cre and DTG mice at 8 weeks or 12 weeks of age determined by echocardiographic analysis. Values are mean ± SD, and numbers displayed on the column indicate the number of samples. (F) Echocardiographic analyses of LVEDd from Pn-Cre and DTG mice at 8 weeks or 12 weeks of age. (G) Representative images of WGA-FITC conjugate staining of heart tissue at 12 weeks of age (left panels). Cross-sectional area measurements in WGA-FITC conjugate stained hearts from Pn-Cre and DTG at 12 weeks of age (right panel). The bar indicates 50 μm. (H) Representative images of actinin staining of NRCMs stimulated with media conditioned by cardiac fibroblasts from Pn-Cre or DTG mice (left panels). Cell surface area ratio normalized to that in non-treated NRCMs from six independent experiments are shown in right panel. The bar indicates 50 μm. Values are shown as mean ± SD, and numbers displayed on the columns indicate numbers of samples. *P<0.05 between two indicated groups by unpaired Student’s t-test.

