
Fig. 3. Loss of LSEC autophagy does not affect liver homeostasis.
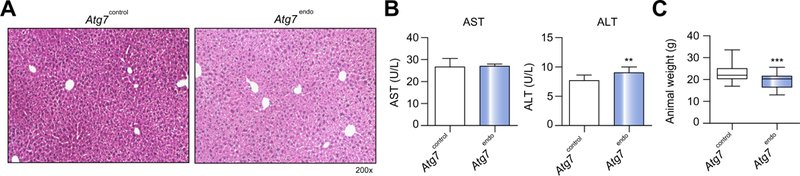
(A) Representative images of whole liver H&E staining showing a normal liver architecture. (B) Aminotransferase levels (n = 12) and (C) animal body weight (n = 69) from Atg7endo and Atg7control mice under basal conditions. Data shows mean value ± SEM. (*p ≤0.05, **p ≤0.01, ***p ≤0.001, Student’s t test). H&E, hematoxylin and eosin; LSEC, liver sinusoid endothelial cell. (This figure appears in colour on the web.)