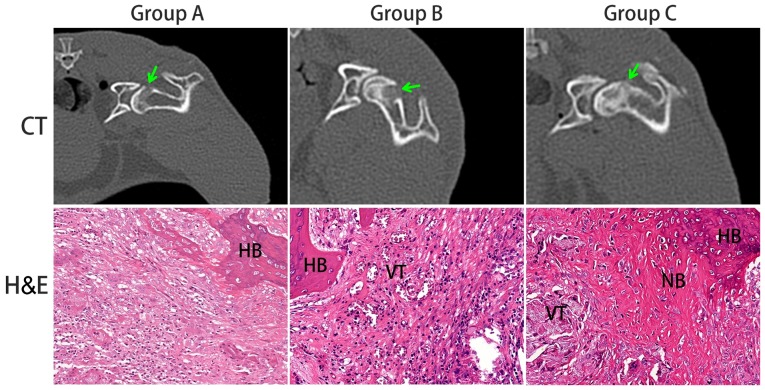
Figure 4.
CT images and HE micrographs at 4 weeks post-operation. The CT images suggested that the osteogenesis in the decompression tunnel of group C was significantly higher than that in the other two groups. Histology micrographs of H&E staining of bone tunnels (×200) of the three groups. CT, computerized tomographic scanning; NB, new bone; HB, host bone; VT, vascular tissue; H&E, hematoxylin and eosin.

