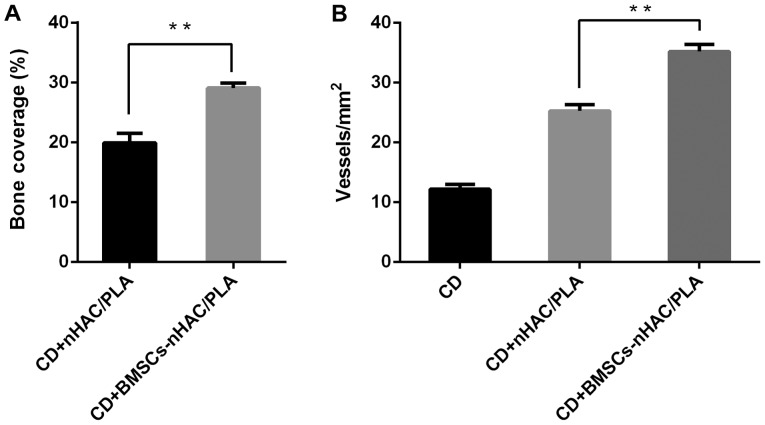
Figure 6.
Bone coverage and microvascular density. (A) The percentage of bone coverage (group B and C) was measured at the experimental site. Data are presented as the mean ± SD. **P<0.01 according to the Student's two-sided unpaired t-tests. (B) The number of vessels at the experimental site (groups A, B and C) was calculated. Data are presented as the mean ± SD. **P<0.01 according to one-way analysis of variance and post hoc Bonferroni's tests. nHAC/PLA, nano-hydroxyapatite/collagen I/poly-L-lactic acid; CD, core decompression.

