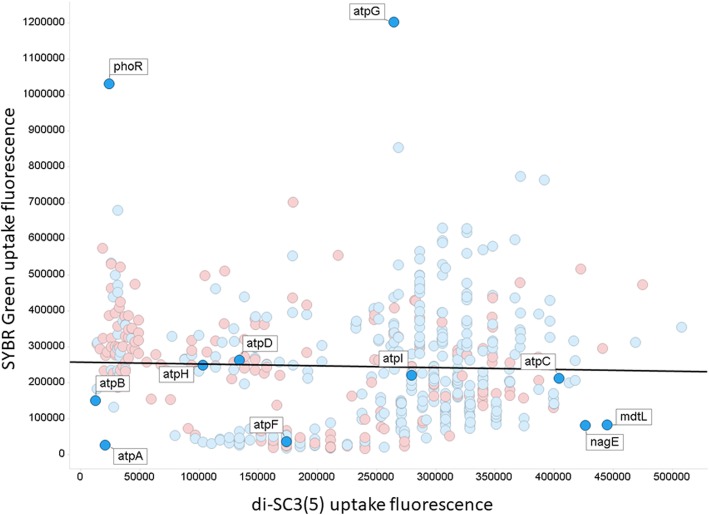
Fig. 9.
Relationship between the uptake of SYBR Green (ordinate) and of diS-C3(5) (abscissa). The line is a line of best fit (r2~0.002). Also shown are some of the knockout labels as discussed in the text. Symbols for y-genes are in red, others in blue. Experiments were performed as described in the Materials and Methods section

