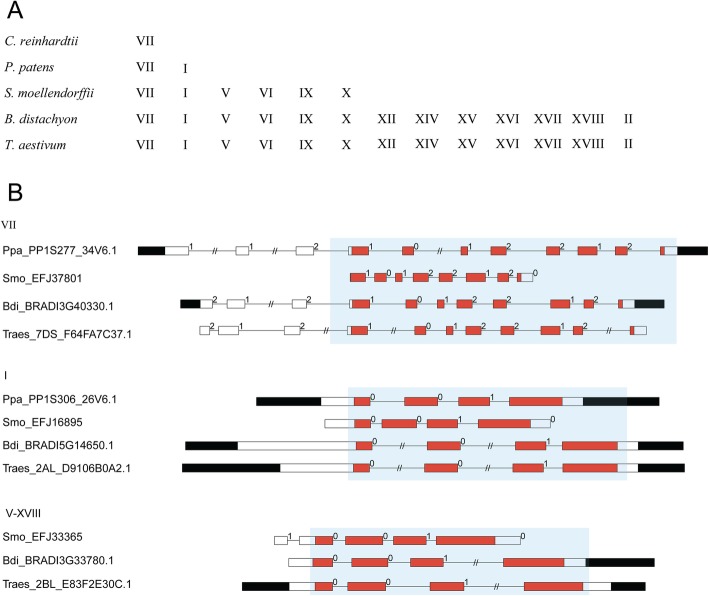
Fig. 2.
Conserved exon-intron structures of PRXs. a The evolutionary history of the PRX subfamilies. b The diagram indicates that conserved exon-intron structures with conserved exon phases were present in the PRX domain. Filled boxes: red represents the PRX domain; black boxes: untranslated regions (UTRs); white boxes: other exon regions; lines: introns; numbers 0, 1, and 2: exon phases. The lengths of the boxes and lines are scaled based on the lengths of the genes. The long introns are shortened by “//”

