
Fig. 2.
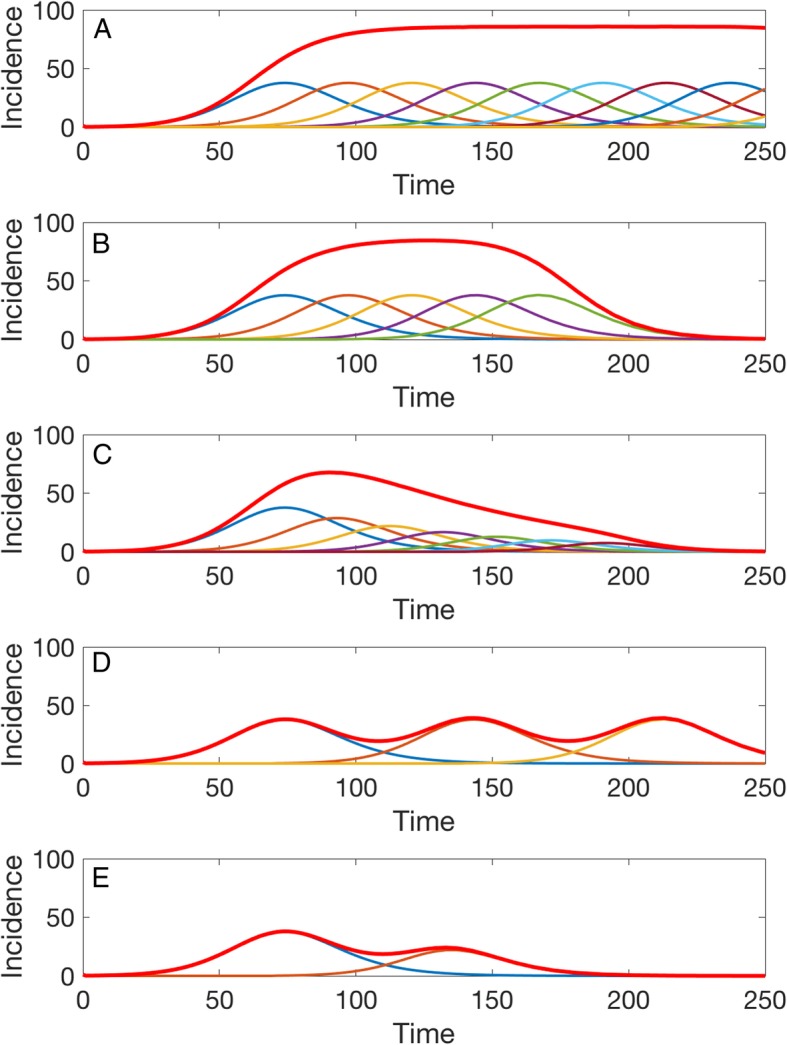
Epidemic wave profiles or the taxonomy of overlapping sub-epidemic waves. Five representative epidemic waves comprised of sub-epidemics characterized by the following parameters: r = 0.15, p = 0.9, K = 2000. a The first panel shows a stationary 300-day endemic wave comprising 10 sub-epidemics with a cumulative case threshold Cthr of 20 cases and parameter q = 0. b The second panel displays a temporary endemic wave comprising 5 sub-epidemics with a cumulative case threshold Cthr of 20 cases and parameter q = 0. c The third panel shows an epidemic wave comprising 10 declining sub-epidemics with a cumulative case threshold Cthr of 20 cases where subsequent sub-epidemics decline exponentially with rate q = 0.3. d The fourth panel displays an epidemic wave with sustained oscillations composed of three sub-epidemics with a high cumulative case threshold Cthr of 800 without the effects of interventions (q = 0). e Finally, the fifth panel shows an epidemic wave with damped oscillations comprising two sub-epidemics where the second one is affected by interventions or behavior changes (q = 0.6) and is triggered once the first one has accumulated 40% of its total size