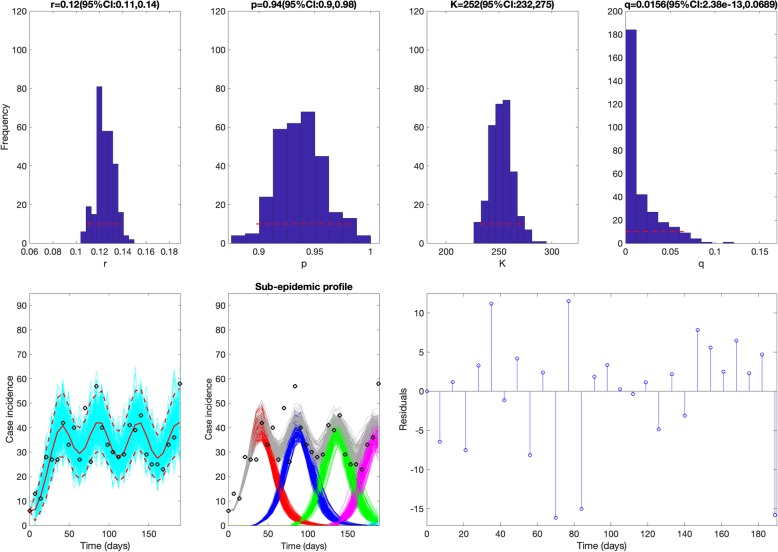
Fig. 6.
Best fit of the sub-epidemic model to the Ebola epidemic in DRC. Based on the first 28 weeks of the Ebola epidemic in DRC (06 Sep 2018 to 11 Mar 2019), our sub-epidemic model yielded the best fit to the incidence curve. Moreover, our results predict an epidemic wave comprised by 4 sub-epidemics of stable size (~ 250 cases) as the parameter q is estimated to be very low, suggesting a stable incidence pattern. Further, parameter estimates are well identified as indicated by their relatively narrow confidence intervals. For instance, the 95% confidence interval for the sub-epidemic size ranges from 232 to 275. The top panels display the empirical distribution of r, p, K, and q. Bottom panels show the model fit (left), the sub-epidemic profile (center), and the residuals (right). Black circles correspond to the data points. The model fit (solid red line) and 95% prediction interval (dashed red lines) are also shown. Cyan curves are the associated uncertainty from individual bootstrapped curves assuming a Poisson error structure. Different sub-epidemics of the epidemic wave profile are plotted using different colors

