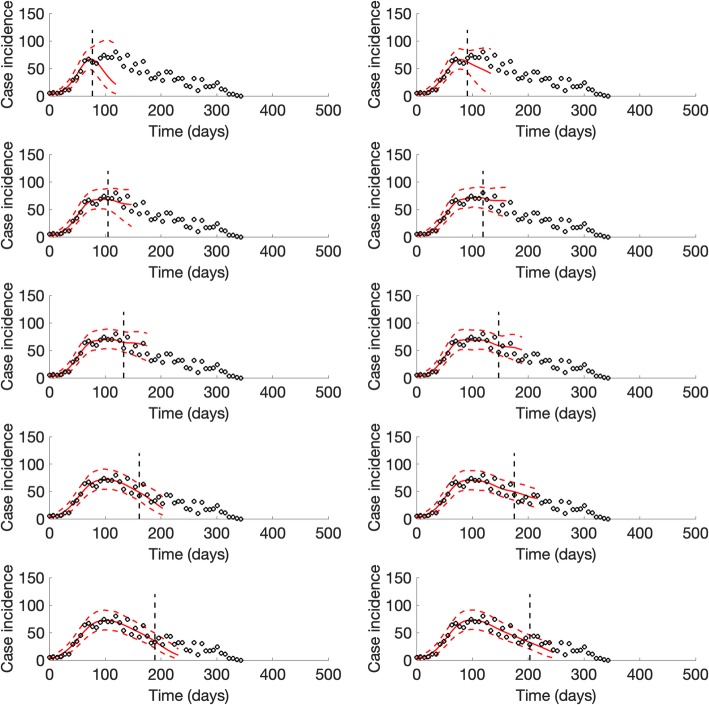
Fig. 8.
Representative 5-week ahead forecasts of the sub-epidemic model to the plague outbreak in Madagascar. The model was able to outperform simpler growth models in short-term forecasts based on the MAE, the MIS, and the coverage of the 95% prediction interval (Table 3). Black circles correspond to the data points. The model fit (solid red line) and 95% prediction interval (dashed red lines) are also shown. The vertical line indicates the start time of the forecast

