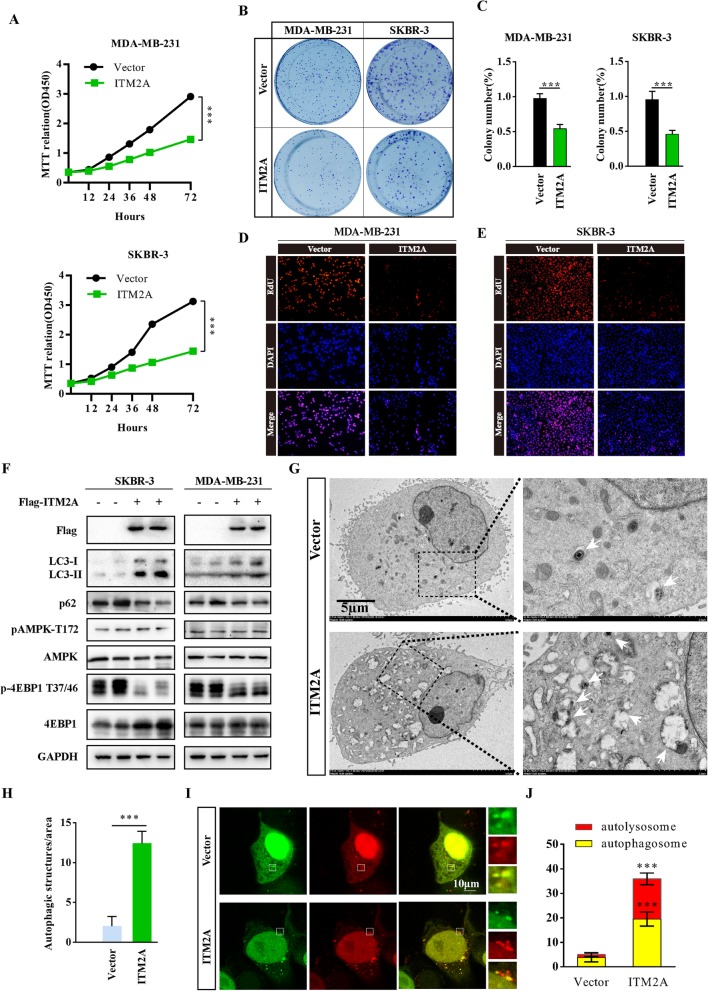
Fig. 2.
Overexpression of ITM2A inhibits breast cancer proliferation through autophagy induction.(a) The growth curve of MDA-MB-231 and SKBR-3 cells transfected with empty vector or ITM2A expression plasmids. (b and c) Colony formation assays were performed for MDA-MB-231 and SKBR-3 cells transfected with empty vector or ITM2A plasmids. (d and e) DNA synthesis of MDA-MB-231 and SKBR-3 cells transfected with ITM2A vectors was assessed by EdU assays. (f) Western blotting analysis in SKBR-3 and MDA-MB-231 cells transfected with empty vector and ITM2A expression vector using the indicated antibodies. (g and h) Representative electron microscope images of autophagosomes or autolysosomes of SKBR-3 cells transfected with empty vector and ITM2A expression vector. Both low- and high-power (zoom) images are displayed. White arrows indicate autophagic structures. The number of autophagic structures was quantified (n = 10). (i and j) Representative confocal images of mRFP-GFP-LC3 puncta in SKBR-3 cells transfected with the ITM2A vector. The numbers of cells showing accumulation of yellow or red puncta were quantified (n = 10). Data are presented as the mean ± SD. Two-tailed Student’s t-test was used. *P < 0.05; **P < 0.01; ***P < 0.001

