Fig. 3.
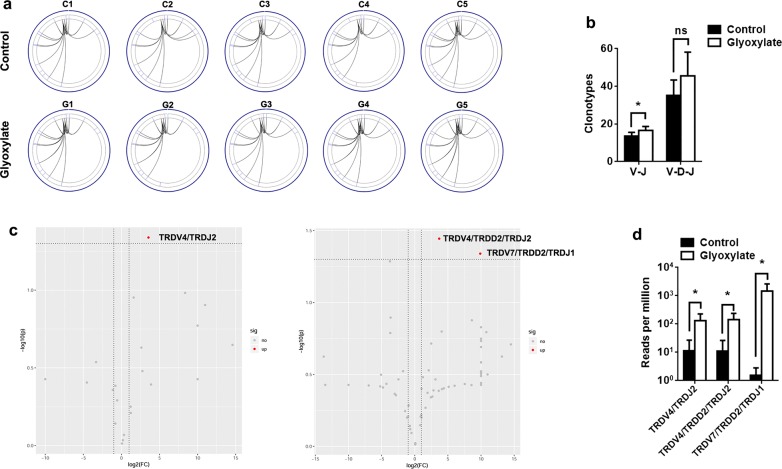
Patterns of V–J and V–D–J combination. a Circular plots representing V–J combinations from TCRδ loci. b Clonotypes of V–J and V–D–J combinations were identified. c Volcano plots representing V–J and V–D–J combinations between glyoxylate and control groups (red dots refer to upregulated combinations). d Comparison of V–J and V–D–J combinations with statistical significance testing (5 mice per group). *P < 0.05; **P < 0.01; ***P < 0.001

