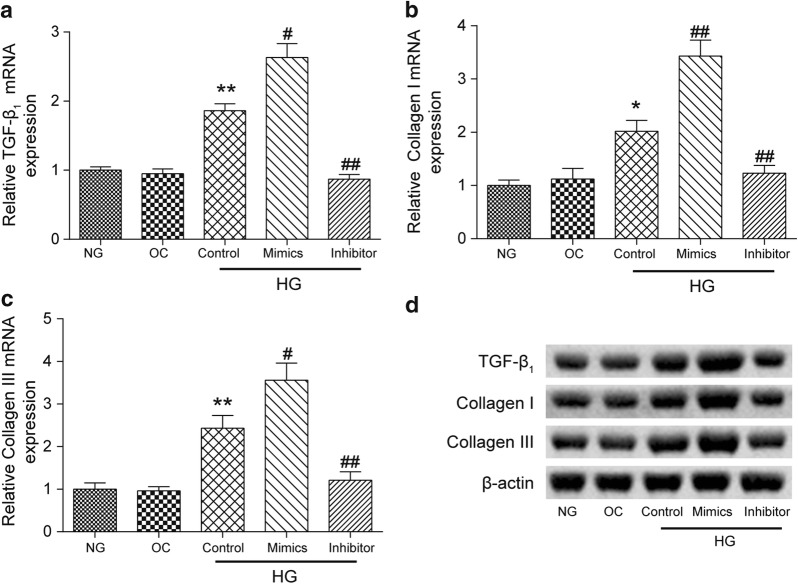
Fig. 3.
Expressions of TGF-β1, collagen I, and collagen III at the mRNA and protein levels in different experimental groups. The mRNA levels of a TGF-β1, b collagen I, and c collagen III were quantified by a qRT-PCR analysis. d The protein levels of TGF-β1, collagen I, and collagen III were determined by a western blot assay. β-actin was used as a loading control. The data were presented as the mean ± SEM (n = 3). *p < 0.05, **p < 0.01 (compared with the NG group), #p < 0.05, ##p < 0.01 (compared with the HG Control group)

