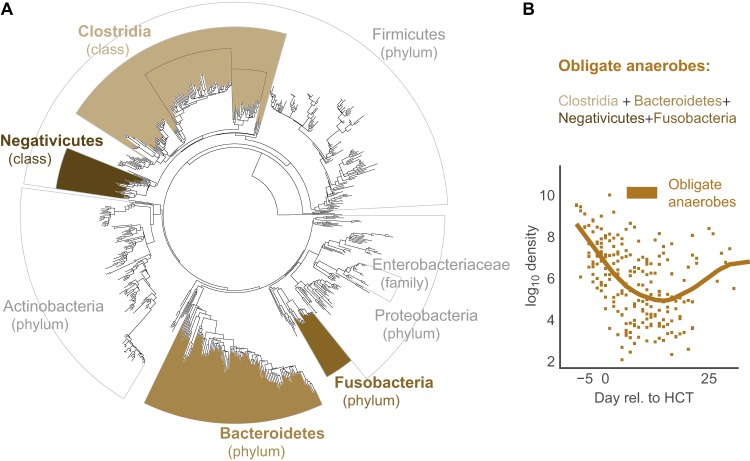
FIG 3.
Obligate anaerobe grouping. (A) Bacterial phylogenetic tree indicating in brown the groups we classified as commensal anaerobes. (B) Average commensal anaerobe density across all patients. The line indicates mean values per day using locally weighted scatterplot smoothing (22).

