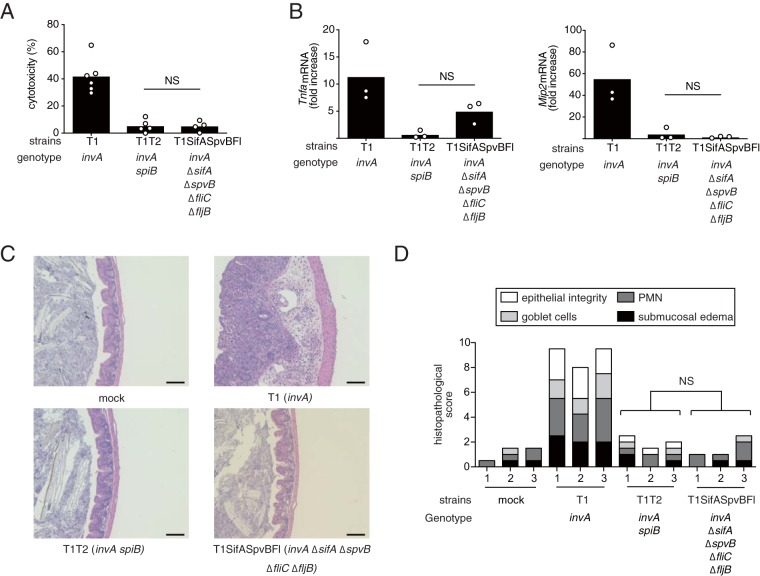
FIG 3.
Effect of different combinations of the sifA, spvB, fliC, and fljB mutations on T3SS-1-independent inflammation in mice. (A) LDH release from RAW cells infected with the indicated S. Typhimurium mutant strains at 20 h after infection. (B) The levels of Tnfa and Mip2 in the ceca of mice infected with the indicated S. Typhimurium strains at 5 days after infection. (C and D) Histopathology of the murine cecum 5 days after infection with the indicated S. Typhimurium mutant strains. Representative images of hematoxylin and eosin-stained cecal sections are shown. Scale bars, 100 μm (C). The histopathology score was determined by blinded examination of the cecal sections. Each bar represents an individual mouse (D). A two-tailed Student t test (A) and the Mann-Whitney U test (B and D) were performed for statistical analysis. Individual data are shown as a scatter plot, and bars indicate the means. Asterisks indicate differences that were statistically significant (P < 0.05). NS, not significant.

