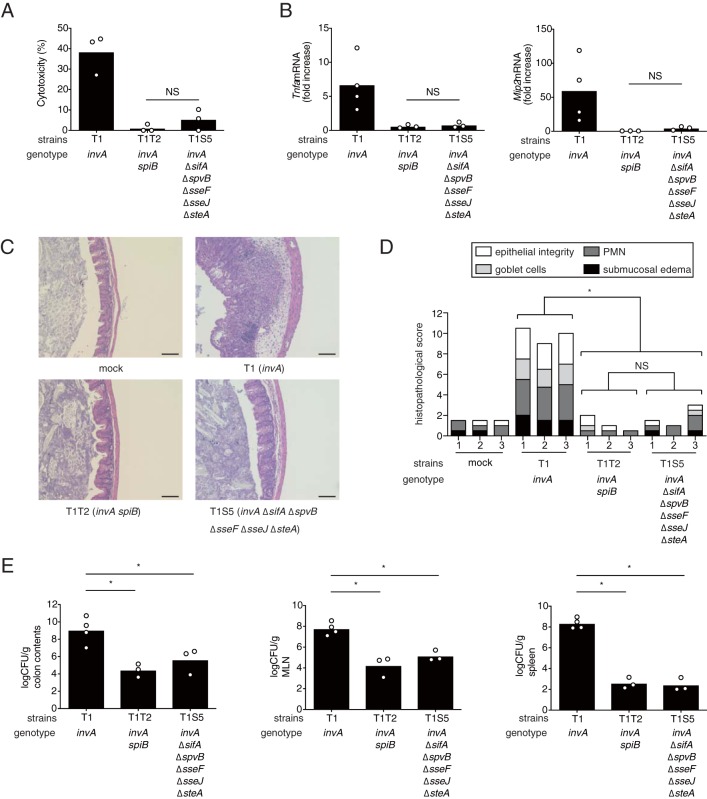
FIG 5.
Effect of different combinations of the sifA, spvB, sseF, sseJ, and steA mutations on T3SS-1-independent inflammation in mice (A) LDH release from RAW cells infected with the indicated S. Typhimurium mutant strains at 20 h after infection. (B) Levels of Tnfa and Mip2 in the ceca of mice infected with the indicated S. Typhimurium strains at 5 days after infection. (C and D) Histopathology of the murine cecum 5 days after infection with the indicated S. Typhimurium mutant strains. Representative images of hematoxylin and eosin-stained cecal sections are shown. Scale bars, 100 μm. (C) Histopathological scoring of cecal sections. (D) Each bar represents an individual mouse. (E) Numbers of bacteria recovered from colon contents, mesenteric lymph nodes (MLN), and spleens of mice. A two-tailed Student t test (A) and Mann-Whitney U test (B, D, and E) were performed for statistical analysis. Individual data are shown as a scatter plot, and bars indicate the means (A, B, and E). Asterisks indicate differences that were statistically significant (P < 0.05). NS, not significant.

