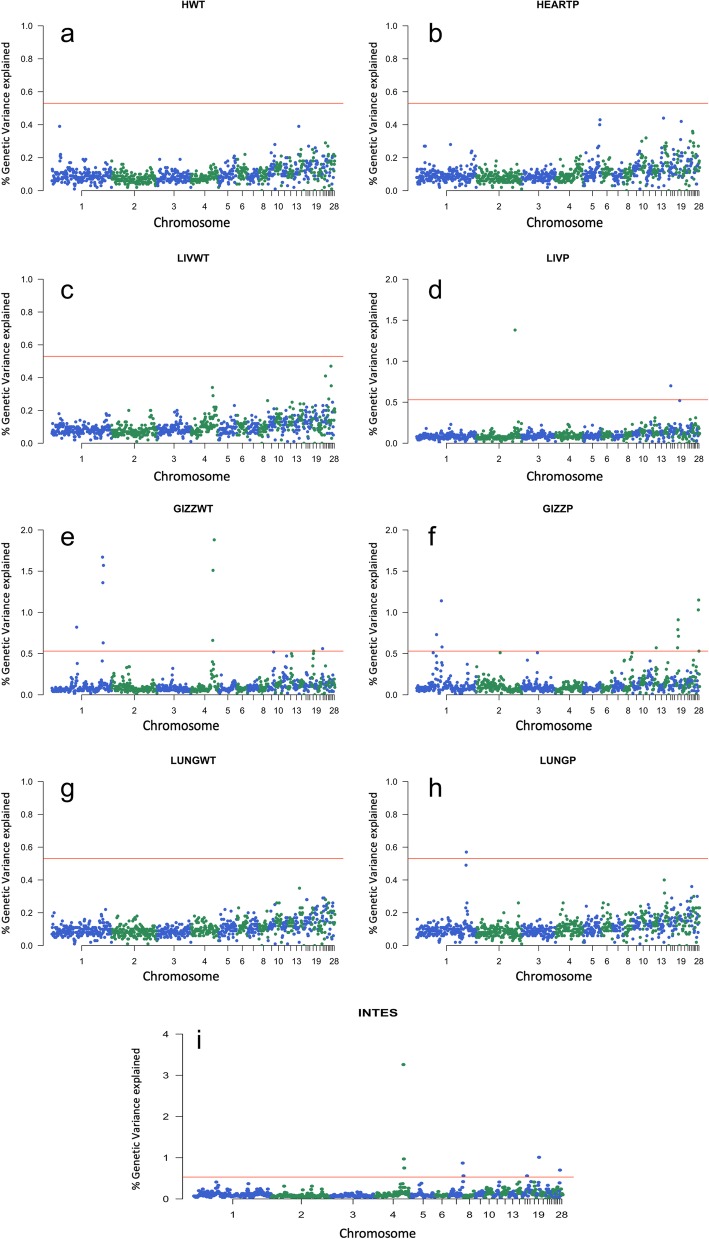
Fig. 1.
Manhattan plots of the posterior means of the percentage of genetic variance explained by each 1 Mb SNP window across the 28 autosomal chromosomes for heart weight (a), heart weight as a percentage of body weight (b), liver weight (c), liver weight as a percentage (d), gizzard weight (e), gizzard weight as a percentage (f), lung weight (g), lung weight as a percentage (h), and intestine length (i). The X-axis represents the chromosomes, and Y-axis shows the proportion of genetic variance explained by each window from Bayes B analysis. Red lines indicate the threshold to deem significant SNP windows

