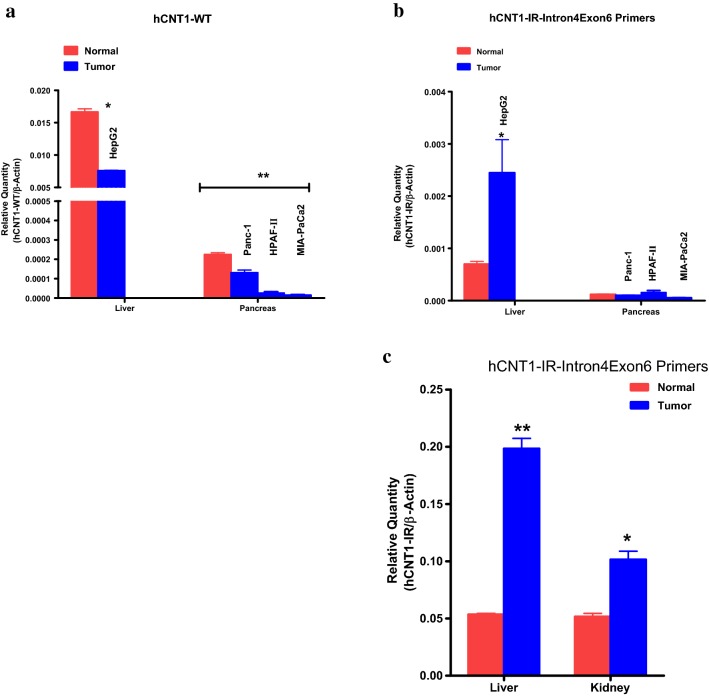
Fig. 4.
Comparative quantitative RNA analysis of hCNT1-IR or normal hCNT1 (hCNT-WT) transcript expression in human normal and tumor tissues or cancer cell lines. RNA was quantified from different tissues and cells using quantitative reverse transcription real-time-PCR (RT-qPCR). a Expression of normal hCNT1 transcript in normal human liver or normal human pancreas tissue (red), and in the human liver cancer cell line HepG2 or human pancreatic cancer cell lines Panc-1, HPAF-II and MIAPaCa2 (blue). b Relative expression of novel splice variant hCNT1-IR in the normal human liver and pancreas tissues (red) and in the human liver cancer cell line HepG2 and pancreatic cancer cell lines Panc-1, HPAF-II and MIAPaCa2 (blue). c Relative expression of novel splice variant hCNT1-IR in normal human liver or kidney tissue (red) and commercially available liver or kidney tumor tissue (blue). Each data point represents the mean and standard deviation of the mean from two independent experiments run in triplicate samples. *p < 0.05, **p < 0.01

