
Fig. 2.
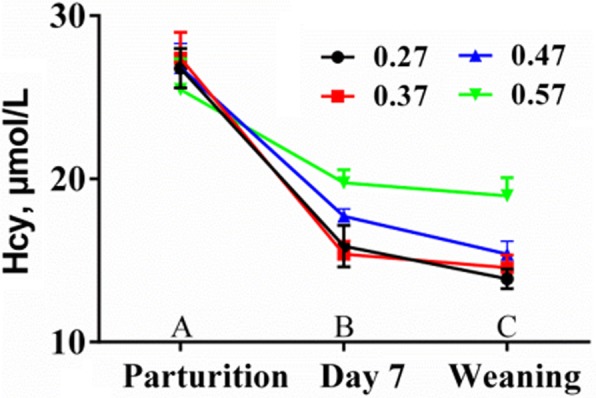
The trend change in homocysteine (Hcy) in plasma along with the lactation process. Blood samples were collected from the ear vein of sows at the morning feeding and 2 h later. Data are presented as the means±SEM, n ≥ 11/lactation diet. A-CMeans in the same row with different letters differ significantly, P < 0.01