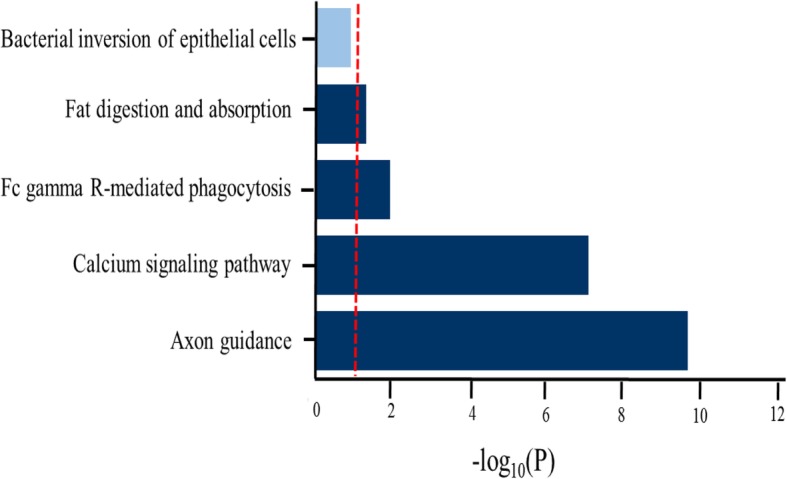
Fig. 3.

KEGG pathway enrichment analysis for genes in red module. The red vertical line indicates the threshold of the significant pathway enrichment p value after FDR correction. Dark blue color of horizontal bars represents the significantly enriched pathway, and the light blue color represents the non-significantly enriched pathway
