Fig. 3.
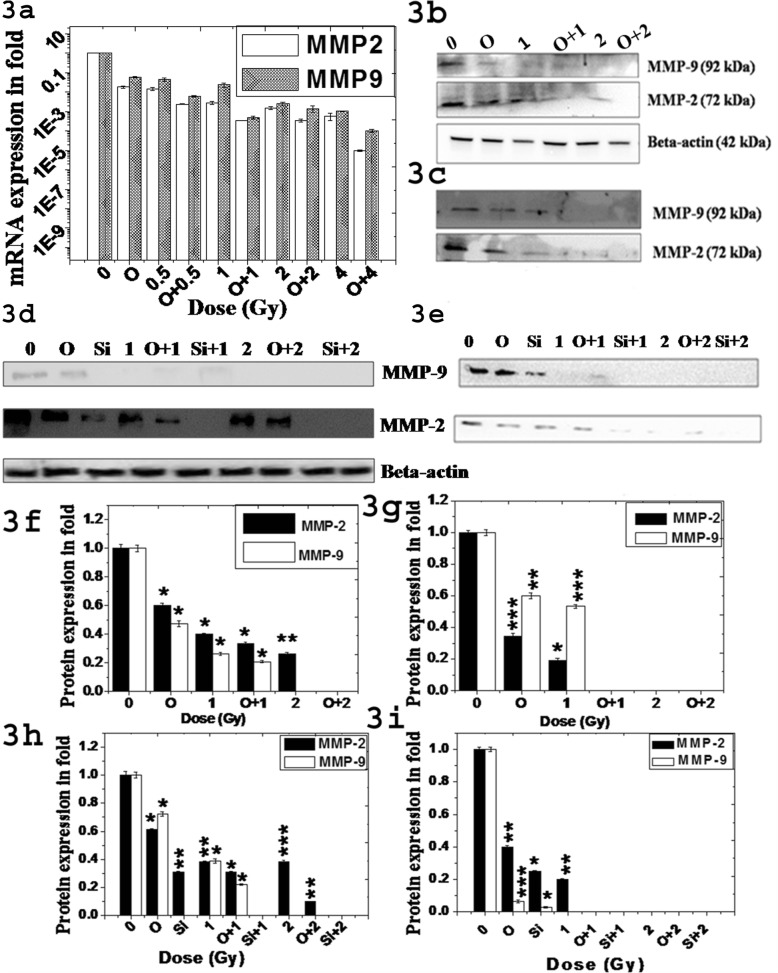
Expression of MMP-2 and MMP-9 in A549 and H1299 cells treated with 12C with and without olaparib (O). a Relative mRNA expression of MMP-2 and MMP-9 in A549 cells after 24 h treatment as determined by Real Time PCR. Each bar represents mean expression ± standard deviation obtained from three independent experiments. All the differences with respect to control are significant and p-values at each dose was p ≤ 0.001 in each cell-type. b-c & d-e Typical western blot to determine expression of MMP-2 and MMP-9 from whole cell lysate in b (A549) & d (H1299) and their respective secretion in culture medium in c (A549) & e (H1299). f,g, h & i Relative expression as measured in fold of MMP-2 and MMP-9 from whole cell lysate f (A549) & h (H1299) and their respective secretion in culture medium in g (A549) & i (H1299)

