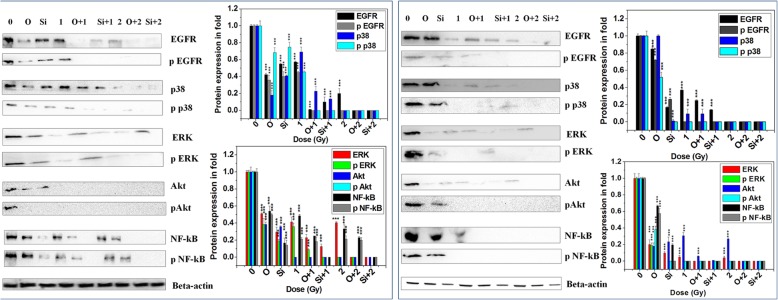
Fig. 4.
Expression and phosphorylation status of the proteins involved in the upstream signaling pathway in the transcriptional regulation of MMP-2,-9 in H1299 (left panel) and A549 (right panel) cells after 12C ion exposure with and without olaparib (O) or siRNA against PARP-1. The bar graphs in each panel represents the quantitative analysis of the proteins as obtained from densitometric analysis of the bands from three independent experiments using imageJ

