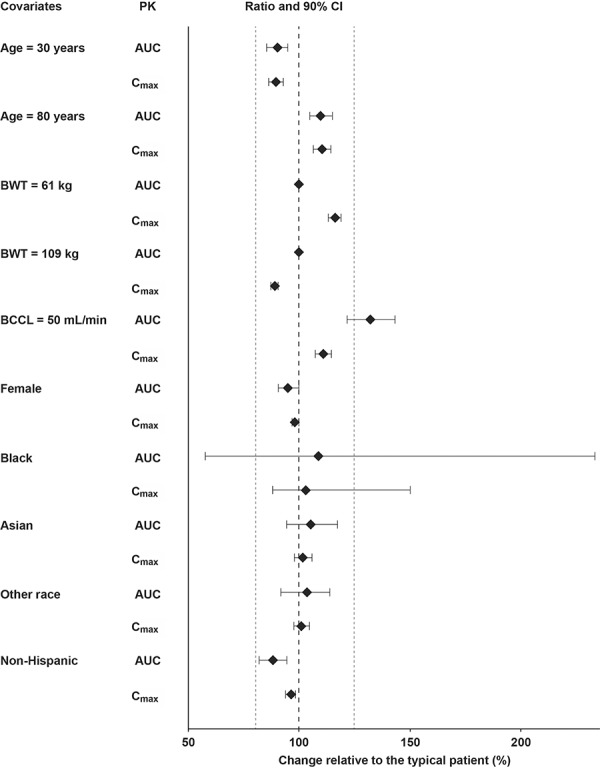
Figure 3. Impact of covariates on the PK of tofacitinib in patients with psoriatic arthritis. Grey dotted line represents limits of a range from 80 to 125%. Magnitude of change is presented in reference to a typical baseline patient (White, male, Hispanic, body weight 83.3 kg, age 50 years, BCRP 0.49 mg/dL, BCCL 120 mL/min). Weights of 61 and 109 kg represent the 10th and 90th percentiles of body weight. BCCL of 50 mL/min with reference to the typical patient (49 mL/min was the lowest BCCL in the analysis). Point estimates for AUC and Cmax were generated using the individual parameters obtained using the population PK model, and the CIs were generated from 1,000 nonparametric bootstrap runs. AUC = area under the concentration-time curve over a dosing interval; BCCL = baseline creatinine clearance; BCRP = baseline C-reactive protein; BWT = baseline body weight; CI = confidence interval; Cmax = maximum steady-state concentration; PK = pharmacokinetics.

