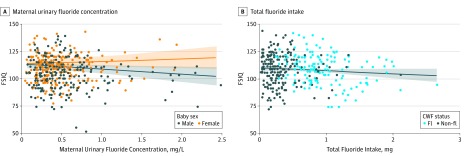
Figure 3. Covariate Results of Multiple Linear Regression Models of Full Scale IQ (FSIQ) from Maternal Urinary Fluoride Concentration by Child Sex (n = 512) and Total Fluoride Intake Estimated from Daily Maternal Beverage Consumption (n = 400).
B, Community fluoridation status (CWF) is shown for each woman; black dots represent women living in nonfluoridated (non-Fl) communities and blue dots represent women living in fluoridated (Fl) communities.

